
Balance Sheet Workout
Sign up to access your free download and get new article notifications, exclusive offers and more.

Balance Sheet
October 6, 2025
What is a Balance Sheet?
A balance sheet presents a list of a company’s assets, liabilities and equity at the end of the most current (and previous) reporting period. It is built on the fundamental accounting equation (assets = liabilities + equity) and provides the structural integrity for the financial statements.
A balance sheet presents a snapshot of a company’s financial position at the end of a financial period, unlike the income statement which is a record over a period of time.
The main objective of a balance sheet is to outline all the resources (assets) available to a business and how they are funded (liabilities). The liabilities and equity items provide the funds which are invested in assets. Many professionals refer to the balance sheet as a statement of sources and uses.
Key Learning Points
- A balance sheet provides a snapshot of a company’s financial position and lists all its assets, liabilities and equity items
- It is based on the accounting equation where: Assets = Liabilities + Equity
- It is one of the key financial statements that companies are required to produce in their annual reports (10-K)
- The balance sheet is a useful source of information to aid to better understand the financial performance of a company (financial modeling and valuation assignments)
- The statement contains many items and specifically lists assets in order of their liquidity i.e how easily they can be converted to cash with little to no loss of value
How to Read a Balance Sheet

Source: Felix – The Coca-Cola Company – Balance Sheet
There are variations in the details of how balance sheets are presented, particularly globally, but the fundamentals remain the same. The assets are listed in order of liquidity; so, cash and cash equivalents appear at the top while the last asset listed is intangibles and other assets.
In this example we can see that Coca-Cola’s most liquid assets (Cash and cash equivalents) are valued at $10,828m in 2024. Short-term investments are also considered a proxy cash item and listed as $2,020m. At the bottom of the Assets there is Goodwill ($18,439m) and Other noncurrent assets of $13,403m, which are deemed largely illiquid.
The most common presentation follows the accounting equation, with assets first, followed by liabilities and equity. This format is illustrated in the above statement. Some businesses rearrange the equation to show assets – liabilities = equity.
Historical Cost Basis
The balance sheet statement provides a historical record of past transactions and their impact on assets, liabilities, and equity. This means that the amounts shown are unlikely to approximate market values. If the asset is shown on the balance sheet it may well be market value, but it might have been purchased many years earlier.
For many assets, decreases in their value are recorded, whereas increases are not. This is to ensure the accounts do not overstate the value of any assets and remain prudent.
Inventory, for example, is recorded at cost initially even though the resale value may be expected to be higher than cost. (As raw materials are turned into work in progress or finished goods, they should logically increase in value.) However, if it is expected that the inventory will need to be sold at a loss, then the amount on the balance sheet will be written down to the expected recoverable amount. Inventory that is old or unsaleable is typically written off or sold at a loss.
Balance Sheet Components Explained
The balance sheet statement is comprised of assets, liabilities and equity. There are many items which fall into one of the three categories, and these are shown below:
Assets: Cash and Cash Equivalents
Cash and cash equivalents include cash and highly liquid assets with a short term to maturity (usually 90 days). This item is always categorized as a current asset as it can be accessed quickly.
Assets: Short Term Investments
Short-term investments are also known as marketable securities which can be very quickly converted to cash. A company with a surplus of cash may purchase these short-term financial assets until a longer-term plan is in place.
Assets: Inventories
Inventories are a line item that represents the purchase price of goods held for resale. In a production-based business the inventory is made up of raw materials, work in progress and finished product. Inventory contributes to COGS (cost of goods sold) and is valued using either the First In First Out (FIFO) or Last In Last Out method. Again, these are classed as assets and can be sold off in a liquidity event.
Assets: Accounts Receivable
Accounts receivable is the amounts due from customers in respect of sales made to them on credit net of expected returns. These are typically short-term or current assets.
Assets: Property, Plant and Equipment (PP&E)
Property, plant and equipment is the tangible (physical substance) long-term assets expected to be used by the business for more than one year. They typically incur high costs to the business but produce benefits over several years. Subsequently their cost is allocated to the income statement over time using a process called depreciation. These are classed as long-term or noncurrent assets.
Liabilities: Accounts Payable
Accounts payable represents the amount due to suppliers for goods and services that have been delivered.
Liabilities: Income Taxes Payable
Income taxes payable are the taxes amount expensed in the prior period modified for adjustment to prior period’s estimates.
Liabilities: Debt
Debt is a line item that will represent a major source of funding for most businesses. It is a contractual liability and involves a commitment to repay the amount borrowed (principal) as well as all interest payments. The amounts must always be paid on the due date regardless of circumstances.
Equity
Equity represents the ownership stake in the business. It provides a source of funding but unlike liabilities, no repayment obligation exists. Equity is further divided into shareholders’ equity and retained earnings. It is the amount of money available to shareholders after all the company’s assets are liquidated and debts are paid off in the event of a liquidation.
Balance Sheet vs. Income Statement vs. Cash Flow Statement
Let’s take a moment to compare the three main financial statements and what each provides:
What is the Balance Sheet?
The balance sheet shows the financial position of the company at a particular point in time. It can also be referred to as the statement of financial position. It’s a snapshot of all of the company’s assets, liabilities, and equity on a specific date.
To put it simply, one half of the balance sheet shows everything the company owns and the other half shows everything that it owes. In other words, its liabilities and its equity, which ultimately belongs to the shareholders. These two sides must balance giving this statement its name.
What is the Income Statement?
The income statement shows the profit or loss made by the business over a certain period of time, which is why it is also sometimes called the profit and loss account or P&L account. It shows the revenue a business has made from sales, as well as any other income, such as interest on investments and deducts from this. All of the costs a business has incurred, such as the cost of the goods they’ve sold, any marketing or admin expenses, as well as interest and tax expenses incurred. If total revenue is more than total costs, then the company has made a profit.
What is the Cash Flow Statement?
This financial report shows all the cash movements over the reporting period (typically a year or a quarter). By showing the cash inflows and outflows, investors and financial professionals can gauge the operating efficiency of the company. It is also a good insight into the liquidity of the business.
The cash flow is typically divided into three reporting segments – cash flow from operations, cash flow from investing and cash flow from financing. If a company cannot generate enough cash flow from operations, it will be unable to meet its investing and financing obligations and potentially face a liquidity issue.
The cash flow and balance sheet will have a close relationship as any cash outflows, such as repayments of debt, will result in a lower debt figure on the balance sheet. Similarly, asset sales and purchases will show both as cash movements on the CF statement and also move the balance sheet asset figures.
In this table we compare the key features of the balance sheet, cash flow statement and the income statement:
| Aspect | Balance Sheet | Income Statement | Cash Flow Statement |
| Purpose | Shows financial position at a specific point in time | Shows profitability over a period | Shows cash inflows and outflows over a period |
| Timing | Snapshot (e.g. as of Dec 31) | Period-based (e.g. Jan–Dec) | Period-based (e.g. Jan–Dec) |
| Key Components | Assets, Liabilities, Equity | Revenue, Expenses, Net Income | Operating, Investing, Financing cash flows |
| Accounting Basis | Accrual | Accrual | Cash basis |
| Focus | What the company owns and owes | How much the company earned and spent | How cash is generated and used |
| Use Case | Assess liquidity, solvency, capital structure | Evaluate profitability and performance | Understand cash generation and liquidity |
| Interconnection | Net income flows into retained earnings | Net income is the result of revenues and expenses | Starts with net income (indirect method) and adjusts for non-cash items and working capital changes |
Why Understanding the Balance Sheet Matters
The balance sheet is one of the core financial statements taught in accounting and finance. It introduces students to the accounting equation: Assets = Liabilities + Equity.
Understanding a balance sheet builds the groundwork for analyzing more complex financial concepts like leverage, liquidity, and valuation.
For Investors, a balance sheet reveals a company’s assets, liabilities, and equity, helping investors evaluate its liquidity, solvency, and capital structure. It supports decisions about whether a company is financially stable enough to invest in or lend to. Key ratios like debt-to-equity and current ratio are derived from balance sheet data.
Managers use the balance sheet to understand resource allocation, working capital, and funding needs. It helps guide strategic decisions such as expansion, cost control, or capital investment. Monitoring changes over time can highlight operational strengths or financial risks.
What a Healthy Balance Sheet Looks Like
A healthy balance sheet reflects a company’s strong financial position and stability. Here are the key characteristics of a healthy balance sheet:
Strong Asset Base
A healthy balance sheet should have sufficient current assets (cash, accounts receivable, inventory) to cover current liabilities, indicating good liquidity. Valuable long-term assets (property, plant, equipment) should support ongoing operations and future growth of the company.
Low Debt Levels
Companies should have manageable short-term obligations that can be easily met with current assets. Reasonable levels of long-term debt, indicating that the company is not over-leveraged.
Positive Equity
A well-run company should have positive shareholders’ equity, and a strong equity position. This shows that the company has retained earnings and capital contributions from shareholders.
Good Liquidity Ratios
A good liquidity ratio would be a current ratio of current assets to current liabilities greater than 1, ideally between 1.5 and 2, indicating the company can meet its short-term obligations.
A quick ratio of (current assets – inventory) to current liabilities of greater than 1, shows the company can meet short-term liabilities without relying on inventory sales.
Healthy Solvency Ratios
A low debt-to-equity ratio, typically less than 1, indicates that the company is not excessively reliant on debt financing. A high interest coverage ratio, indicating that the company can comfortably cover its interest expenses with its earnings before interest and taxes (EBIT).
Positive Working Capital
Positive working capital (current assets minus current liabilities), indicates that the company has sufficient short-term assets to cover its short-term liabilities.
Consistent Profitability
Retained earnings, accumulated profits that have been reinvested in the business, showing a history of profitability and growth.
Example of a Healthy Balance Sheet
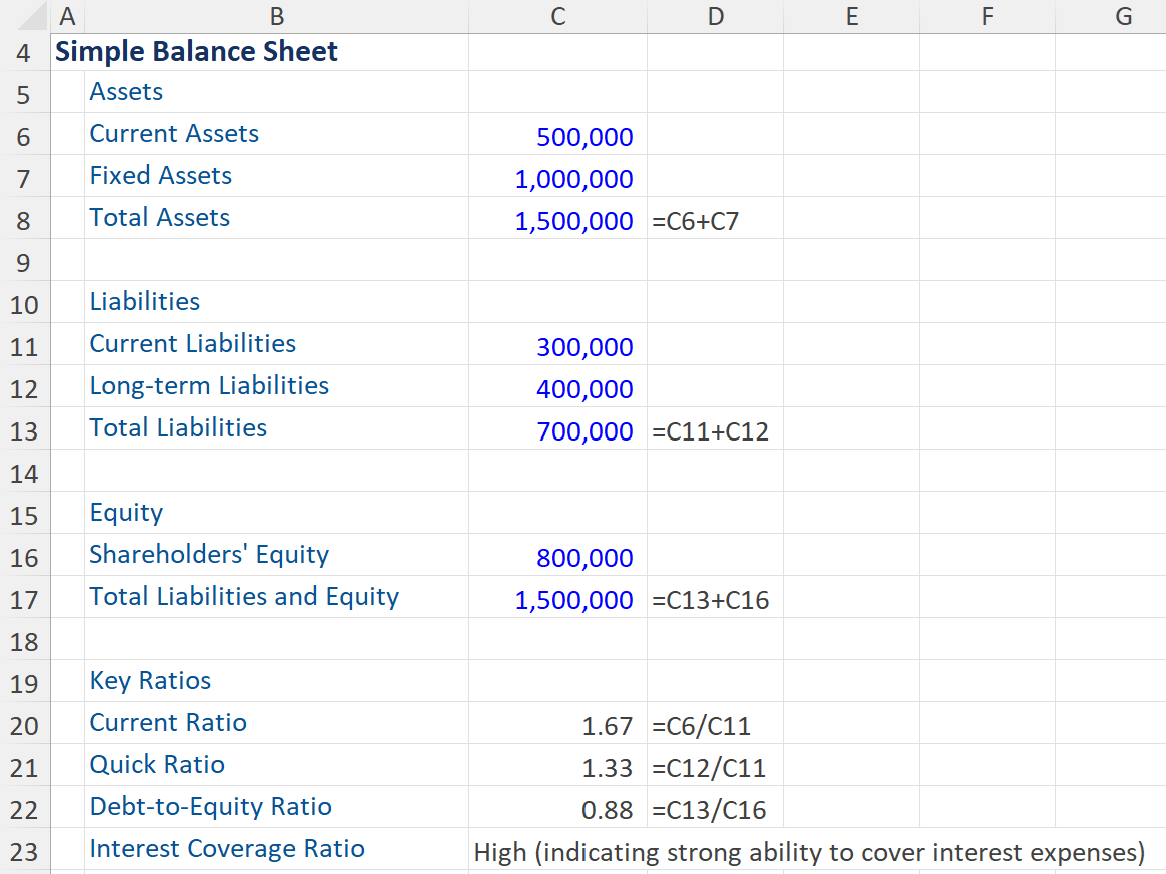
A balance sheet with these characteristics indicates that the company is financially healthy, with a strong asset base, manageable debt levels, and sufficient liquidity to meet its obligations.
Download the free Financial Edge template to test your knowledge of assets and liabilities on a balance sheet. The Excel download will also demonstrate how to build a balance sheet from the information provided.
Conclusion
Understanding a balance sheet is crucial for anyone involved in financial analysis, investment, or business management. It provides a snapshot of a company’s financial position at a specific point in time, detailing its assets, liabilities, and equity. This information is essential for assessing a company’s liquidity, solvency, and overall financial health.
By mastering the components and interpretation of a balance sheet, you can make more informed decisions, whether you’re evaluating a potential investment, managing a business, or simply seeking to enhance your financial literacy. Remember, the balance sheet is just one piece of the financial puzzle, but it’s a foundational one that offers valuable insights into a company’s stability and performance.