New Wharton Programs – Private Equity • FP&A • Real Estate • Value Investing – Save $200
Semi-Deviation
September 24, 2025
What is Semi-Deviation?
Semi-deviation is a measure of downside risk that accounts only for the downside volatility in the price of an asset or an investment. While standard deviation considers both the positive and negative volatility around the mean equally, semi-deviation isolates returns that fall below a certain threshold (typically the mean or a minimum acceptable return). Risk-aware investors would often use semi-deviation as it provides a more accurate perspective of the “bad” volatility of an asset or a portfolio. For example, the overall level of risk as measured by standard deviation could be heavily influenced by occasional large losses, whereas semi-deviation can offer a more realistic view on the downside exposure of an investment and won’t penalize portfolios for taking upside risk. In addition, semi-deviation is often used in calculating risk-adjusted return metrics such as the Sortino ratio, which helps investors to assess whether excess returns adequately compensate for downside variability.
Key Learning Points
- Semi-deviation measures only negative deviations from a benchmark (or the mean), providing a more accurate perspective of potential losses than overall volatility
- It is a popular measure among conservative and risk-averse investors and institutions like pension funds and insurers
- It better reflects the downside risk exposure for portfolios with asymmetric return distributions and avoids overstating the risk resulting from upside variability
- Semi-deviation is key in calculating risk-adjusted performance measures such as the Sortino ratio, which allows investors to evaluate returns against downside risk instead of total volatility
Semi-Deviation Explained
Semi-deviation is a refined downside risk measure which aims to resolve one of the fundamental issues of traditional variance-based metrics – the equal treatment of upside and downside volatility. While measures like standard deviation assume normal distribution of returns, in reality returns would often exhibit characteristics that it would struggle to effectively capture, such as skewness or fat tails. Semi-deviation addresses this by isolating only those returns that fall below a selected threshold, often determined as the mean return, a risk-free rate or a minimum acceptable return.
Semi-deviation also avoids overstating the riskiness of portfolios that produce high but volatile positive returns. Growth-focused strategies could experience large swings on the upside but only moderate downside risk, which standard deviation would flag as higher risk. On the other hand, semi-deviation would provide a more nuanced view by focusing on losses relative to the specific benchmark.
Semi-deviation is widely used across risk-minded institutional investors such as pension funds and insurance companies. This is due to their primary objective to preserve capital and produce a more predictable return rather than maximize their upside potential.
Additionally, semi-deviation is also broadly used in calculating various risk-adjusted returns measures, approaches to portfolio optimization as well as scenario analysis. From a portfolio construction perspective, it could also aid in identifying investments that deliver high performance and where downside risk is minimized.
Formula for Semi-Deviation
The semi-deviation calculates the square root of the average squared negative deviations from the mean (or a return target).
This is expressed in the below formula:
Where:
Ri = the individual return in period i
Rb = the mean (or a specific target or benchmark, for example the risk-free rate or a minimum acceptable return)
n = the total number of observations
nd = the number of returns that fall below the mean (or the target)
min(0, Ri-Rb) = takes only the negative deviations; if , then contribution is 0
Semi-Deviation vs. Standard Deviation
Both semi-deviation and standard deviation are measures of risk or variability of returns but differ significantly in their focus and application. Standard deviation calculates the dispersion of all data points around the mean and captures both upside and downside volatility. Conversely, semi-deviation only considers the variability of values below a reference point (typically the mean) and focuses on negative outcomes.
We compare the two measures in the table below:
| Feature | Semi-Deviation | Standard Deviation |
| Definition | Measures only the returns volatility below a specified target (or the mean) | Measures the overall volatility of returns around the mean |
| Focus | Downside (negative) variability only | Both upside and downside variability |
| Interpretation | High reading indicates higher risk of losses | High reading indicates high overall risk |
| Application | Primarily used by risk-averse investors in their risk analysis and downside risk assessment | Typically used in portfolio risk measurement and general statistics |
| Sensitivity | Sensitive only to negative deviations | Sensitive to extreme values (both gains and losses) |
| Benefits | Focuses on potential losses, making it suitable to assess acceptable risk levels | Simple concept, making it widely used to calculate general volatility |
| Limitations | Less intuitive for general use since it ignores upside volatility | Could easily overstate risk by including gains |
| Relation to other metrics | Used in calculating the Sortino ratio and other downside risk measures | Used in calculating the Sharpe ratio and the coefficient of variation |
| Investor perspective | Conservative – focuses on potential losses | Neutral – considers all deviations |
| Behavior under skewed distributions | More accurate for negatively skewed returns | It can be misleading if the distribution is skewed |
How to Calculate Semi-Deviation in Excel
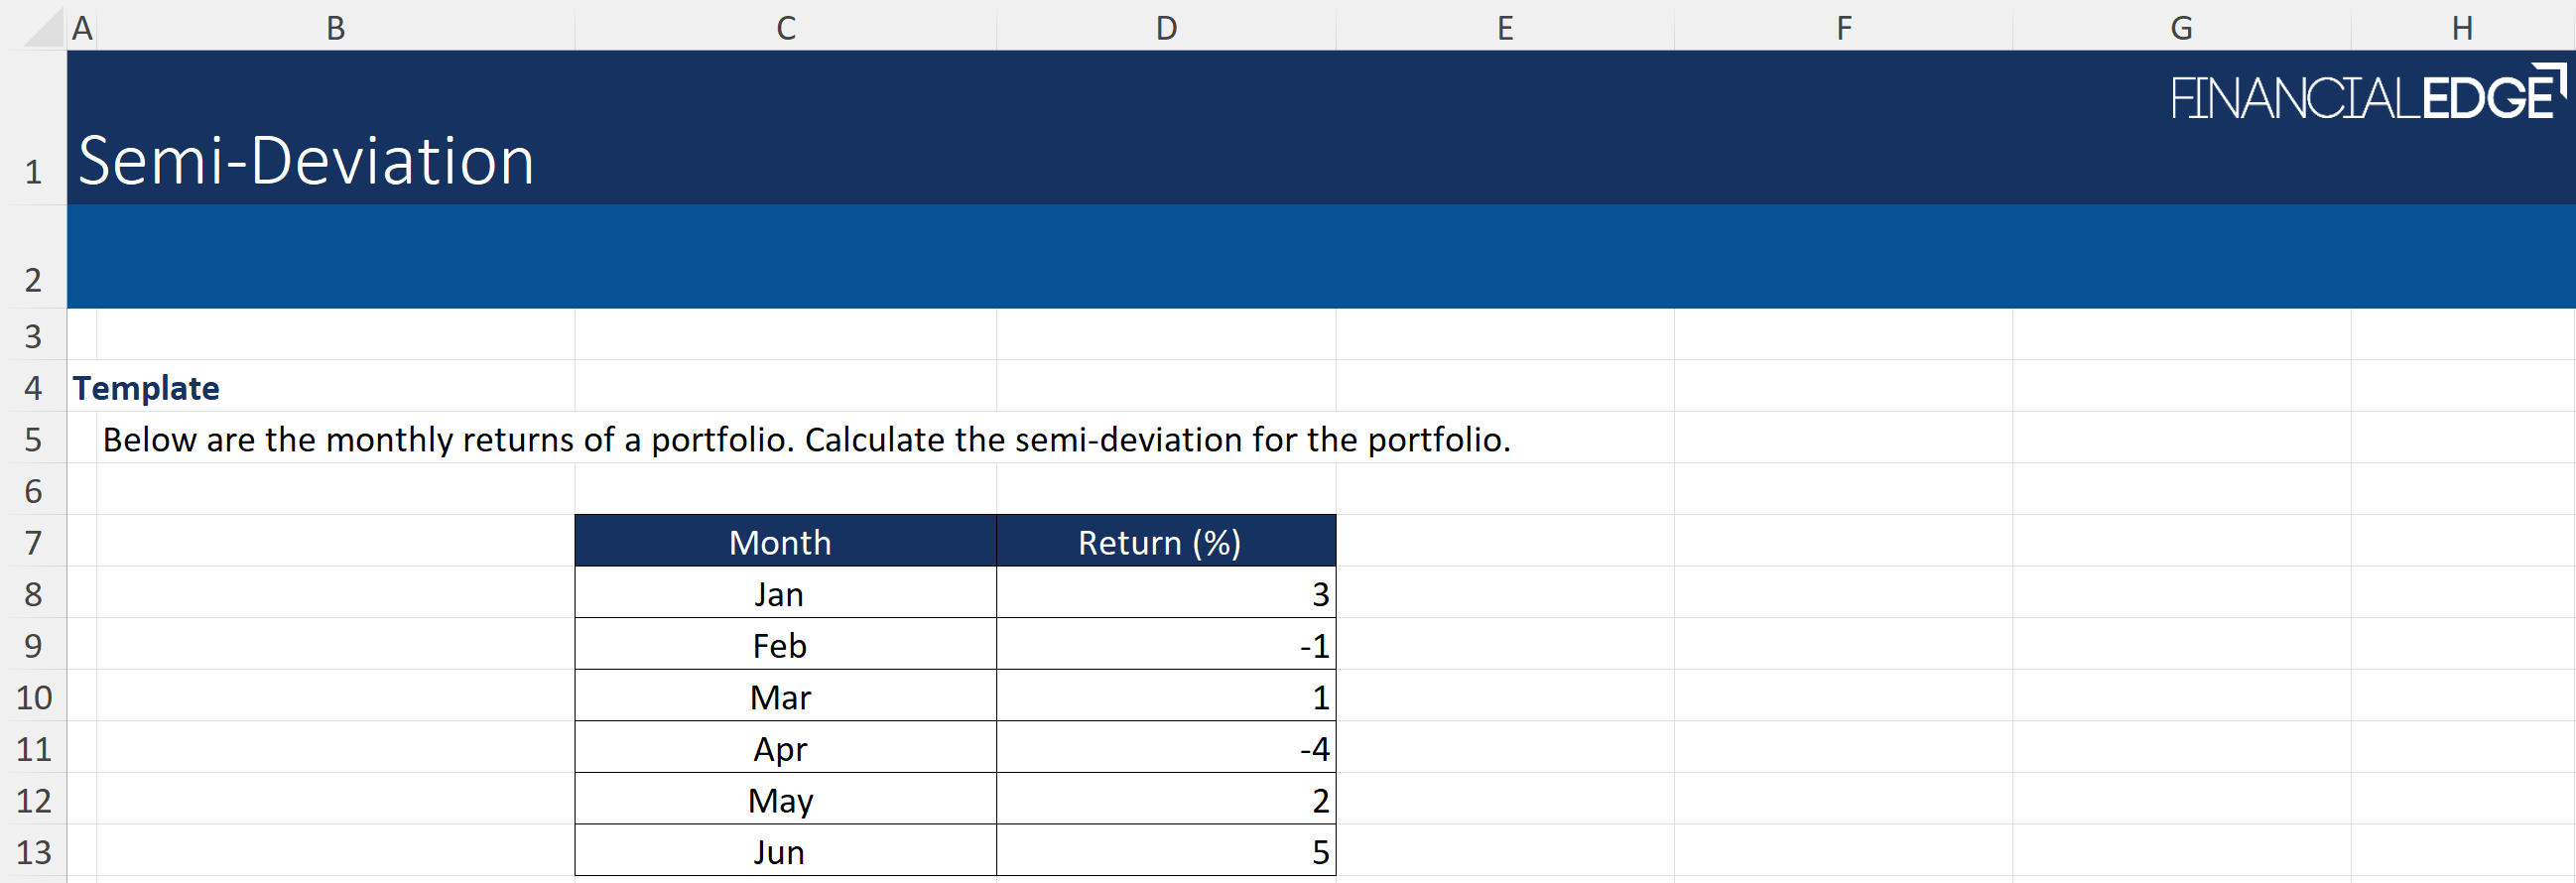
Here is a practical example of how semi-deviation is calculated. This examines a fund’s performance and risk over six months.
Download the free Financial Edge template and follow these steps in Excel.
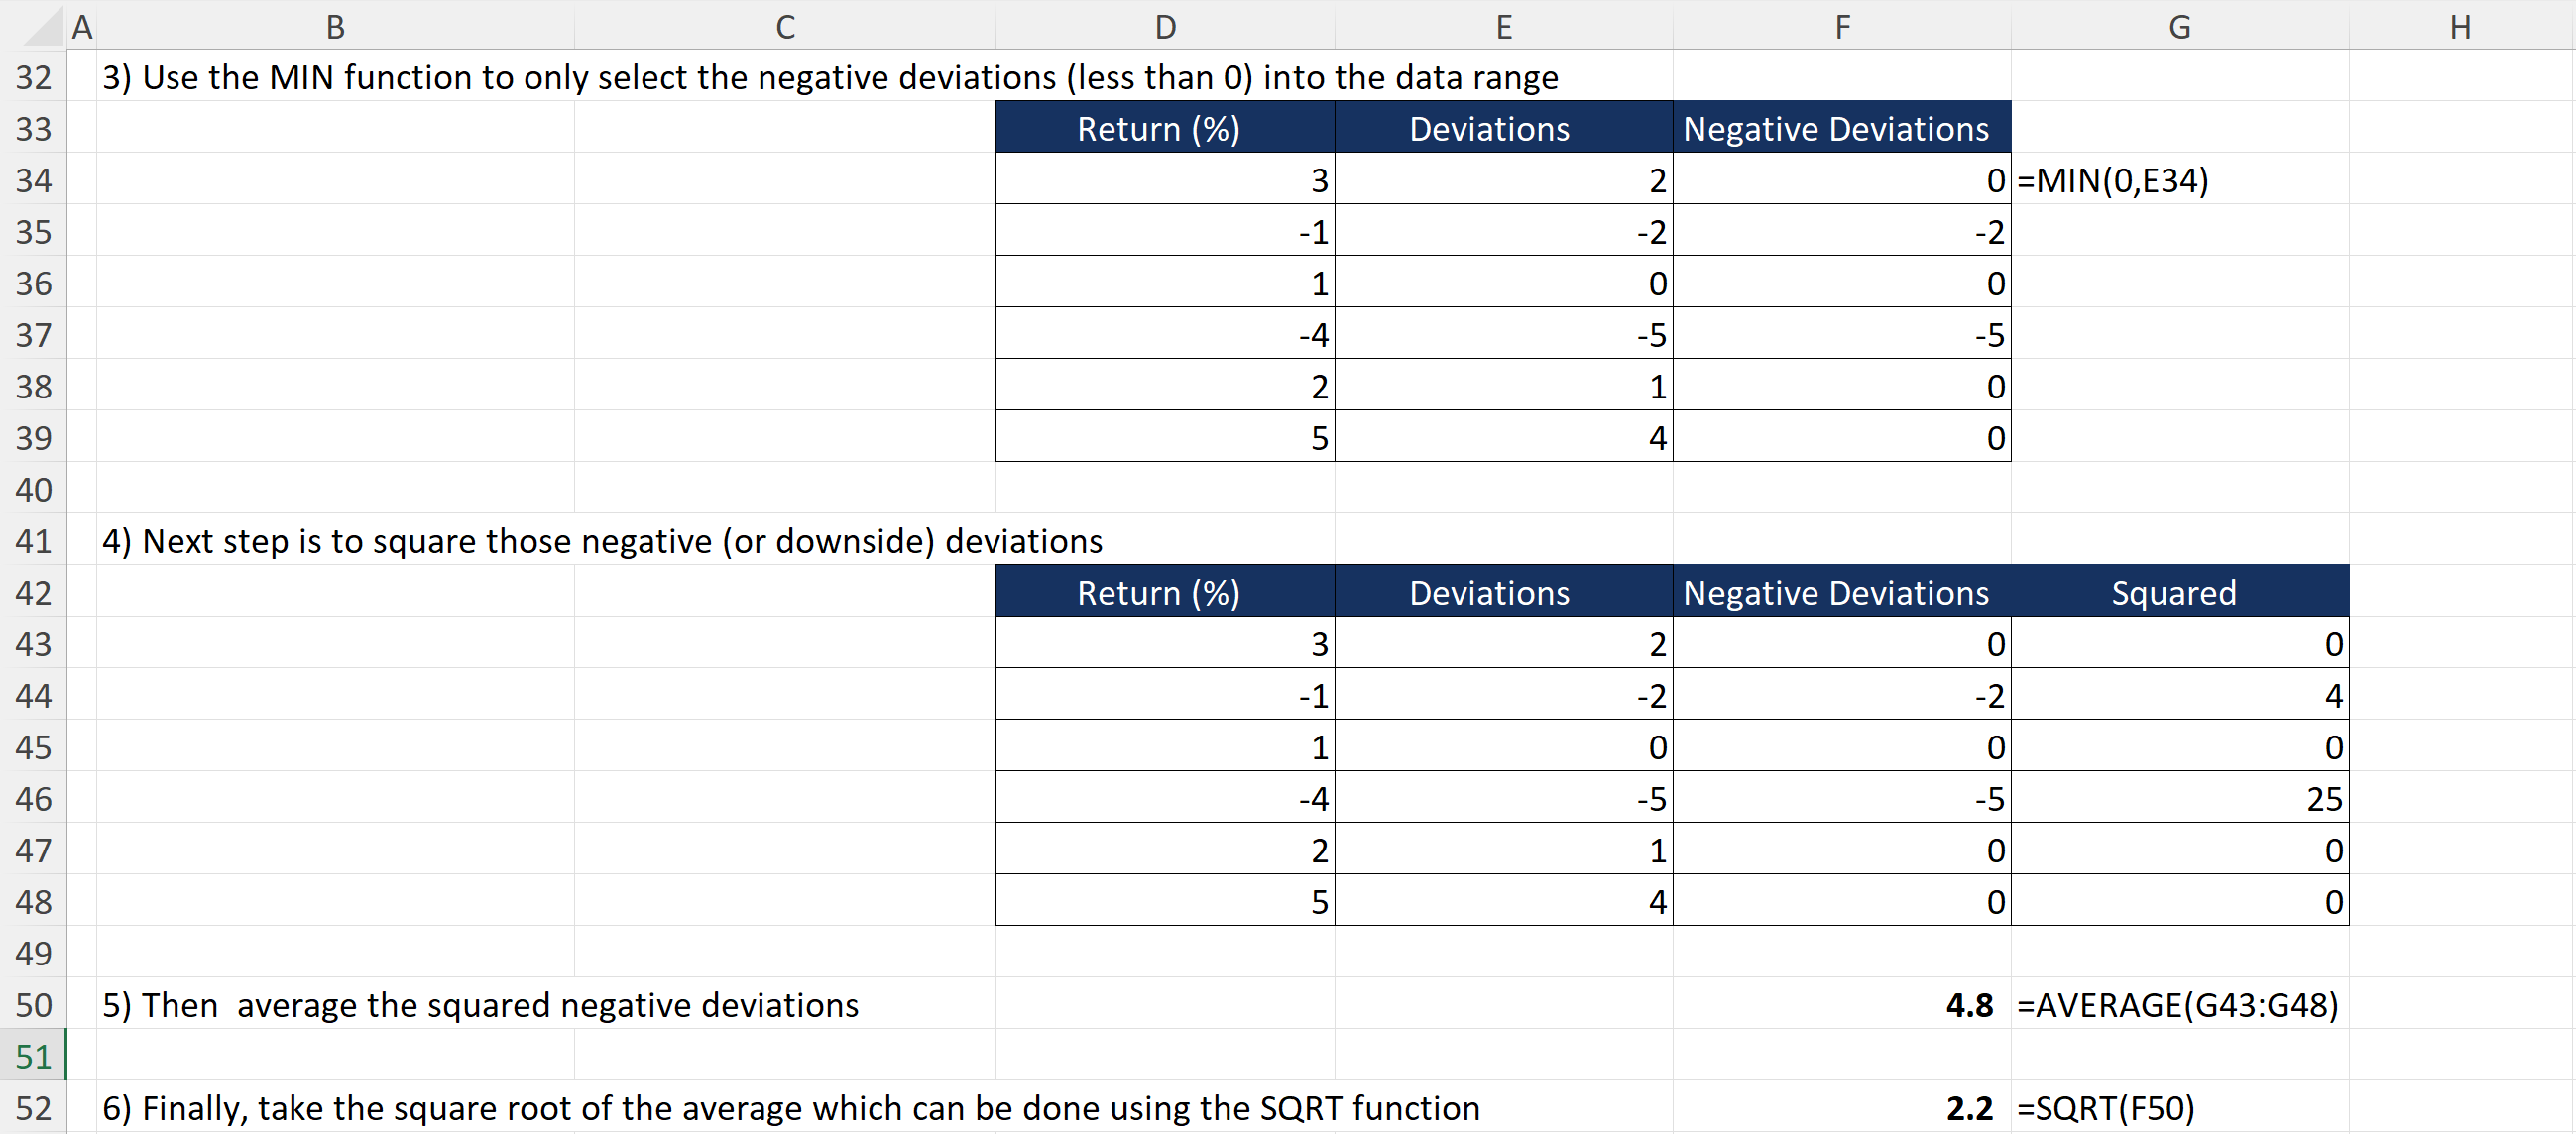
Unlike standard deviation, semi-deviation is not built into Excel and requires a few steps to calculate, as outlined below:
- Calculate the mean of the data range using the AVERAGE Excel function.
- Calculate the deviations from the mean by subtracting the average from each data point to create a range showing the deviations from the mean.
- Keep only the negative deviations – using the MIN function can help here to only select data points below zero.
- Square those negative (or downside) deviations.
- Average the squared negative deviations.
- Square root the average to find semi-deviation using the SQRT function.

These steps are all set up in the Excel template, ready to use.
In the above example, the semi-deviation of 2.2% means that, on average, the downside volatility of this portfolio (relative to its mean return) is about 2.2 percentage points.
If we looked only at standard deviation, the measure would include both up and down fluctuations and would give a larger number (~2.9%).
What is the Sortino Ratio?
The Sortino ratio is similar to the Sharpe ratio in that it is a risk-adjusted return metric. The Sortino ratio measures return as a unit of downside risk, whereas the Sharpe ratio measures total standard deviation.
Sortino Ratio Formula
To calculate the Sortino ratio, investors would subtract the portfolio return from the target return (or risk-free rate). This would then be divided by the downside deviation.
The Sortino ratio formula is shown here:
Sortino Ratio = (Portfolio Return-Target Return) / (Downside Deviation)
The higher the ratio, the better the potential return for each unit of ‘downside risk’ taken. It is a useful measure for those where the likelihood of negative risk is a key concern. It can be used alongside the Sharpe ratio to analyze potential risk and return metrics.
What is Downside Deviation vs. Semi-Deviation?
Downside deviation and semi-deviation both measure the negative or downside risk of an investment. They vary as semi-deviation always focuses on the negative returns compared to the mean of the returns. Downward deviation allows the investor to specify a desired minimum return, known as the minimum acceptable return (MAR).
What is Downside Deviation vs. Standard Deviation?
Standard deviation measures all returns from a portfolio, whether positive or negative, versus the average return from the investment. Downside deviation specifically focuses on returns that are below the minimum threshold that an investor is seeking. Thus, it only focuses on negative returns or returns below a benchmark set by the investor.
Conclusion
To sum up, semi-deviation is a nuanced downside risk metric that specifically focuses on downside volatility. It is popular with sophisticated and loss-conscious investors as it allows for a more accurate perspective on potential losses. Unlike traditional volatility measures that assume normal distribution of returns, semi-deviation is particularly useful for portfolios with skewed or non-normal returns as it avoids overstating risk.


