Standard Deviation
August 25, 2021
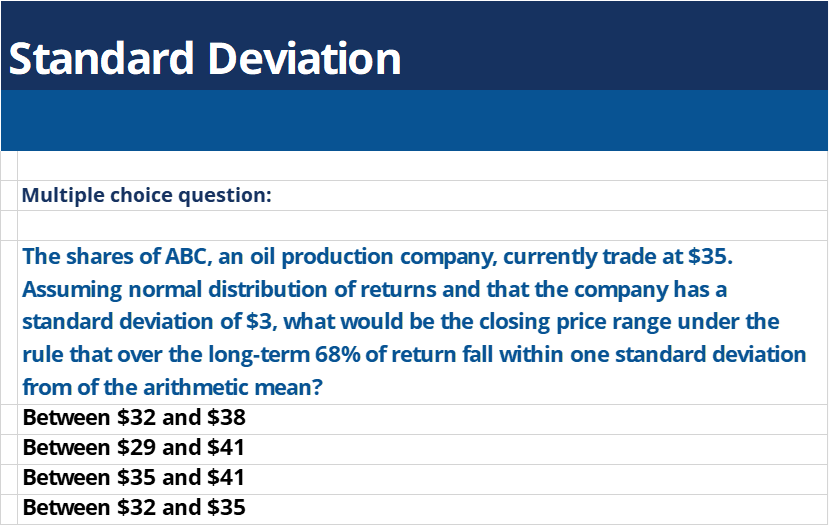
What is “Standard Deviation”?
The standard deviation is a statistical calculation that investors use as a measure of volatility for the market, particular security, or an investment product. It is one of the most popular risk measures that professional and individual investors pay close attention to and shows the magnitude of deviations between various values in a dataset. By quantifying the level of risk, investors would gain better understanding of the required rate of potential returns.
Key Learning Points
- Standard Deviation is a popular measure of volatility that investors use to quantify the level of risk associated with an investment;
- Within a dataset, it calculates the volatility of the spread of asset prices relative to their average;
- A high standard deviation would be an indication for a riskier investment as prices are moving in larger magnitude; and
- A low standard deviation on the other hand would suggest that prices are moving closer to their average and therefore the investment is considered to be lower risk
How Standard Deviation Works?
Standard deviation is one of the key risk metrics that helps investors to determine the level of risk associated with an investment and the required rate of return. It is calculated as the square root of variance by examining the variation between each data point (in this case the price of an asset) against the average.
Formula:
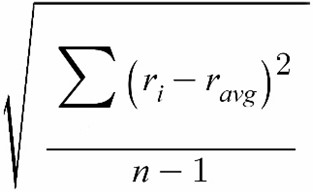
Where:
- ri is the return observed in one period
- ravg is the average i.e. the arithmetic mean of the returns within the dataset
- n is the number of observations in the dataset
Example
A fund manager wants to calculate the standard deviation of her portfolio over the last six months. Historical returns data:
| Month | Return |
| Mar 2021 | 11% |
| Feb 2021 | -8% |
| Jan 2021 | 15% |
| Dec 2020 | 3% |
| Nov 2020 | -9% |
| Oct 2020 | 6% |
- Calculating the arithmetic mean:
Ravg = (0.11-0.08+0.15+0.03-0.09+0.06)/6 = 0.03, or 3%
- Using the formula above:
SD = √(0.11-0.03)²+(-0.08-0.03)²+(0.15-0.03)²+(0.03-0.03)²+(-0.09-0.03)²+(0.06-0.03)² / 6-1
SD = √0.00964
SD = 0.0981, or 9.81%
In its current shape, the investor can expect the returns of their portfolio to fluctuate by approximately 9.8% on a monthly basis. This is a useful indication that might help to change the composition of the portfolio in order to perceive lower or higher risk. For example, large-cap stocks tend to show more stable prices relative to their small-cap peers, and therefore adding some large-cap stocks might reduce the overall volatility of the portfolio.
The Application of Standard Deviation
The normal distribution theory, which is used in statistics to assess the probability of an event occurring, states that over the long-term 68% of returns will fall within one standard deviation of the arithmetic mean, where 95% will fall within two standard deviations and 99% within three standard deviations.
For example, if a stock is priced at £30 and its standard deviation is £5, it can be assumed with 95% certainty that the next closing price will remain between £20 and £40 (within two standard deviations).