
Conditional Value at Risk (CVaR) Template
Sign up to access your free download and get new article notifications, exclusive offers and more.

Conditional Value at Risk
October 1, 2025
What is Conditional Value at Risk (CVaR)?
Conditional Value at Risk (CVaR) is a spectral risk measure that aims to capture the tail risk of a portfolio’s return distribution. It is also referred to as Expected Shortfall (ES). CVaR addresses the key limitation of the traditional Value at Risk measure, which is not providing any estimation of the magnitude of losses that could occur beyond the defined loss threshold (for example the 5% worst-case loss). This is where the CVaR aids investors in quantifying the expected loss conditional on losses exceeding the VaR level. As it focuses on the tail distribution, it is the preferred measure in areas like stress testing and risk-adjusted performance evaluation.
Key Learning Points
- The Conditional Value at Risk (also known as Expected Shortfall), is a risk measure that focuses explicitly on the tail risk of a portfolio’s return distribution
- While conventional Value at Risk (VaR) estimates the potential loss at a given confidence level, CVaR estimates the expected loss conditional on losses exceeding that VaR level
- This makes it highly relevant for fat-tailed or skewed return distributions, where extreme losses are rare, but could significantly impact portfolio performance
- CVaR a coherent risk measure (meaning it satisfies properties such as subadditivity), which provides accurate reflection of the diversification benefits during a portfolio risk assessment
How Conditional Value at Risk (CVaR) Enhances Risk Assessment?
Conditional Value at Risk enhances risk assessment is primarily through addressing the key shortcoming of the traditional Value at Risk metric, which is not able to capture the severity of losses once the threshold is breached. CVaR provides more detailed analysis of the potential losses beyond the VaR limit, which is crucial for sophisticated investors managing portfolios exposed to fat-tailed distributions. It is also used in areas like portfolio optimization as it satisfies subadditivity and ensures that diversification is properly rewarded in the risk calculation.
For example, in a stress testing exercise, where a portfolio is tested at the 95% confidence level, VaR might show a potential loss threshold of 5%. However, CVaR would indicate the expected loss within that worst 5% of scenarios and therefore offer a complete picture of the potential downside. This is extremely important during periods of market turbulence as in practice CVaR values often exceed VaR by a wide margin.
There are a number of academic studies that explore the value that CVaR adds over more conventional measures. For instance, a 2020 study that explored risk forecasting across different asset classes in Brazil between 1997 and 2017, found that 74% of the risk forecasts made using traditional VaR models were statistically inaccurate, while models using CVaR (or other tail-focused measures) showed much better performance, with far fewer rejections (Pinheiro, M.C. and Vinícius, B. 2020).
CVaR is also becoming essential for regulators as it enhances the robustness of scenario analysis and facilitates compliance with regulatory standards. In fact, Basel’s Fundamental Review of the Trading Book (FRTB) regulatory framework is moving toward CVaR for calculating market risk capital. Under the FRTB, banks must report Expected Shortfall at the 97.5% confidence level rather than simply a VaR at 99%.
Calculating the Conditional Value at Risk (CVaR) Formula
The Conditional Value at Risk (CVaR) formula expresses the expected loss beyond the Value at Risk threshold.
This is calculated as per the formula below:

Where:
- L = the loss random variable, representing possible portfolio losses. Higher values correspond to worse outcomes
- a (0,1) = the confidence level (for example 0.95 for 95%). This specifies the quantile of the loss distribution being analyzed
- VaRα(L) = The Value at Risk at level α (alpha). This is the loss level exceeded only 5% of the time
- du = The dummy integration variable that runs from α to 1 in the integral definition. It indexes the quantiles of the loss distribution between the confidence level and the extreme tail
This chart illustrates how CVaR works. The blue curve represents the loss distribution, and the red dashed line shows the VaR threshold. The losses beyond VaR (the tail) are shown in the shaded red area. The black dotted line marks the CVaR, which is the expected loss within that tail.

Comparing VaR and CVaR
The table below explores the key differences between the Value at Risk and the Conditional Value at Risk.
| Aspect | Value at Risk (VaR) | Conditional Value at Risk (CVaR) |
| Definition | Accounts for the maximum potential loss at a given confidence level | Calculates the expected average loss beyond the VaR threshold |
| Focus | Loss threshold (cut-off point) | Loss severity in the tail distribution |
| Sensitivity to Tail Events | Not sensitive to extreme outliers beyond the VaR cut-off | Captures extreme tail events explicitly |
| Reliability in Back Testing | It can underperform in periods of market turbulence | Generally more robust in stress scenarios |
| Distribution Assumptions | Often assumes normal distributions and may underestimate fat tails | Works better with fat-tailed or skewed distributions (non-normal) |
| Calculation | Easier to calculate and widely used | More intensive as it requires tail integration |
| Portfolio Diversification | May not reflect diversification benefits accurately | Properly accounts for diversification due to its coherence |
| Regulatory Usage | Historically used under Basel II/III for market risk | Adopted in Basel FRTB (Expected Shortfall at 97.5%) |
| Capital Allocation | Can underestimate capital needs in turbulent markets | Leads to more conservative capital buffers |
Conditional Value at Risk (CVaR) Excel Example
Below is a practical excel example of how the CVaR is calculated using the daily closing price data for Apple Inc. Download the free Financial Edge excel template to follow the steps online.
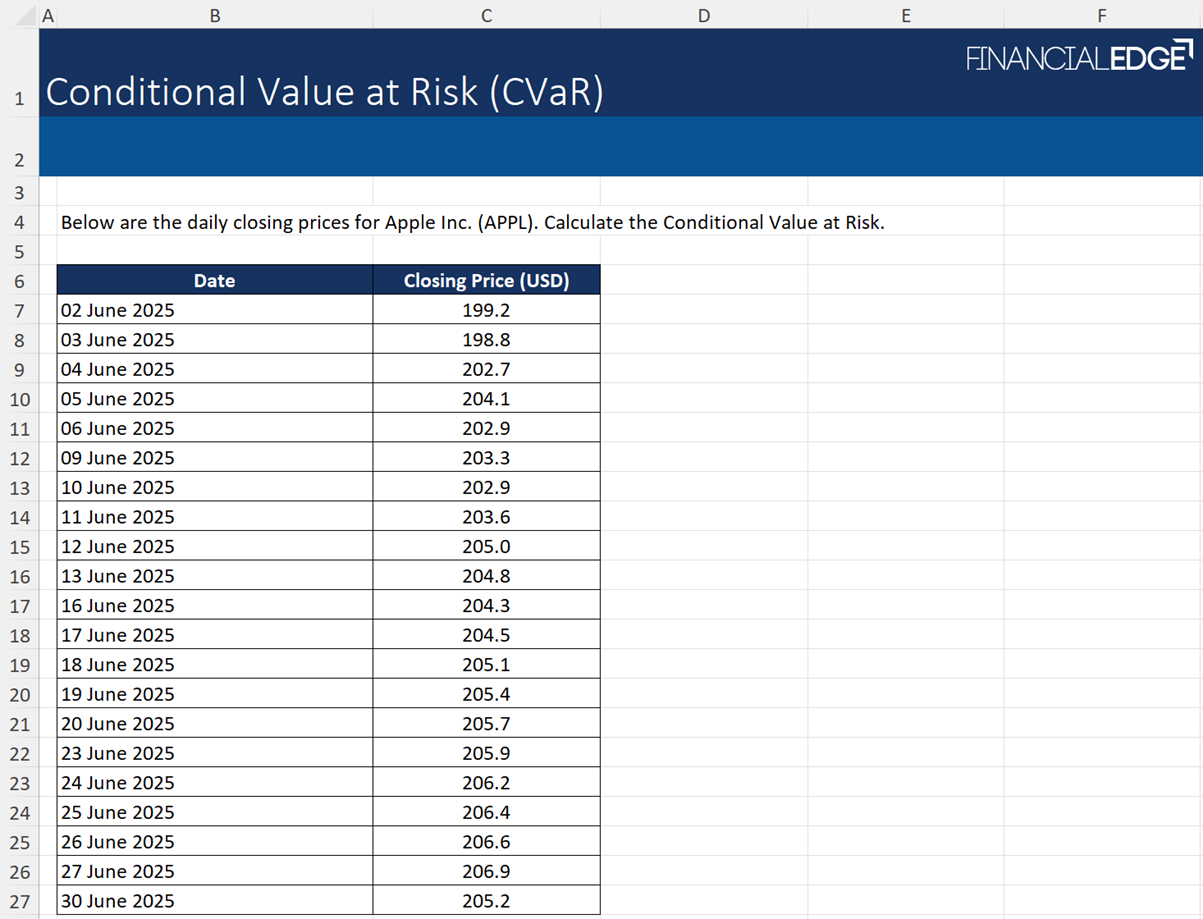
To do the CVaR calculation, we need to follow the below process:
1. Calculate the Daily Returns (the percentage change in price from one day to the next) by using the formula:
Rt = (Pt – Pt-1) / Pt-1
Where:
- Rt = daily return at day
- Pt = closing price at day
- Pt-1 = closing price at previous day
2. Sort the daily returns in ascending order to identify the worst losses. This can be done using the SORT function or by highlighting the data and inserting a filter into Excel
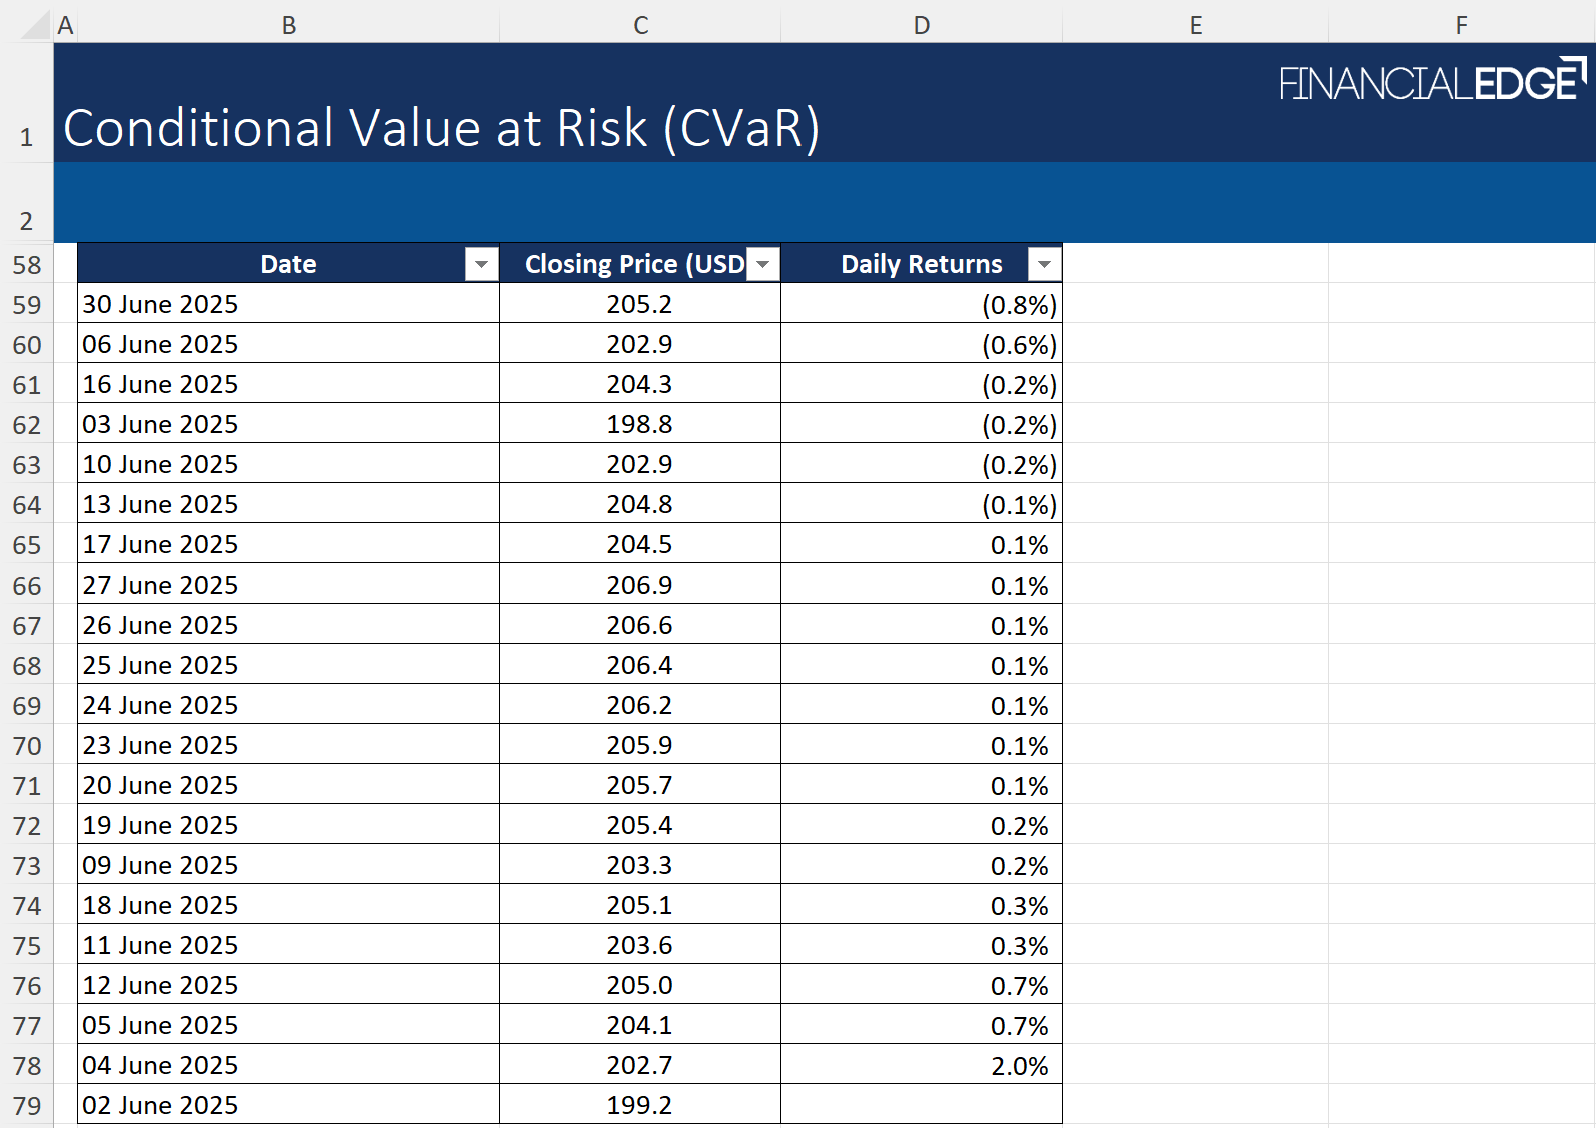
3. The next step is to determine the desired confidence level (for example 95%) and run Value at Risk (VaR) calculation. This can be done using the PERCENTILE.INC function in excel as shown below.
4. The final step is to calculate Conditional Value at Risk (CVaR) by averaging the worst-case returns that are less than or equal to the VaR threshold. This can be done by using the AVERAGEIF function in Excel.

To help interpret the results:
- The VaR shows the maximum expected loss within a specified confidence level
- The CVaR shows the average loss beyond that threshold, giving a more accurate perspective of tail risk
Thus, based on the provided data, we can conclude that the VaR (at a 95% confidence level) is -0.63% and the CVaR (at a 95% confidence level) is -0.82%. The CVaR shows investors the average loss in the worst 5% of cases.
Conclusion
Overall, CVaR is a more robust risk measure compared to traditional measures such as VaR as it focuses not only on the threshold of potential losses but also on the severity of losses beyond that level. CvaR is a critical tool when analyzing the potential losses for extreme or ‘tail end’ events.
In addition, its coherence makes it highly applicable in areas like portfolio optimization or stress testing. Its importance has been further evidenced in regulatory frameworks such as the FRTB that adopt CVaR over VaR.