
Annualized Growth Workout
Send download link to:
Featured Product
Annualized Growth
April 16, 2021
What is “Annualized Growth”?
An annualized growth figure is the average annual growth rate over a given number of years. An annualized growth number is also called the compound annual growth rate (CAGR). Annualized growth numbers remove the unevenness of year-on-year growth rates and smooth the fluctuations (increases and decreases) in these numbers. Annualized growth or rate of return has applications in valuation and LBO transactions.
Key Learning Points
- An annualized growth figure represents the annual growth rate over a given time horizon. It is also known as the compound annual growth rate (CAGR)
- Annualized growth provides a better perspective of growth rates over a period as compared to year-on-year growth rates
- Annualized growth numbers are useful in valuation and LBO transactions
- In valuation, annualized growth rates help in predicting future cash flows. However, annualized figures should be used after careful analysis to minimize the risk of overstating or understating the future growth potential of a business
- In LBO transactions, annualized growth is calculated using the CAGR formula. It helps investors compare returns based on different assumptions and helps in evaluating LBO transactions
The Formula
Annualized growth can be calculated as:
Compound Annual Growth Rate (CAGR) = (Ending value/Beginning value)^(1/number of time periods) -1
The CAGR is the average annual growth rate over a period longer than a year. It is used for determining the growth rate of any metric that is likely to witness highs and lows over time. In the context of valuation, these metrics include sales and EBITDA as these can witness year-on-year fluctuations due to a variety of internal and external factors. Apart from valuation, CAGR is also used to measure the annual growth rate in investment portfolios or other assets.
Example
Here is the five-year sales information for Kate Spade and Company:
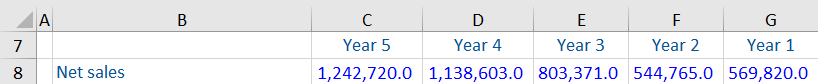
It can be seen that from Year 1 to Year 2 the net sales have dropped, but from Year 2 to Year 5 the net sales have increased markedly. To smooth out the fluctuations and find the stable growth each year, the annualized growth rate for sales can be calculated as follows:
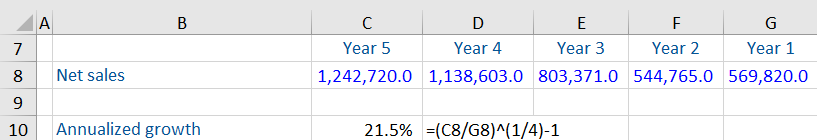
Note that the number of time periods is 4 and not 5. The 4 time periods are: 1) Year1 to Year2, 2) Year2 to Year3, 3) Year3 to Year4 and 4) Year4 to Year5.
Let us look at the year-on-year growth rates for each of these 4 time periods.
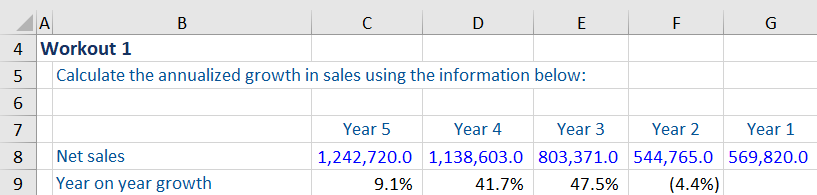
In Year 2, sales had dropped 4.4% from Year 1 levels. In Year 3 and Year 4, sales saw a healthy increase of more than 40% over the prior years. And in Year 5, sales had increased 9.1% from the prior year.
Annualized numbers help remove the unevenness from these highs and lows. If sales were to increase each year steadily from Year 1 to Year 5, they would have increased at a rate of 21.5%.
Annualized Growth and Valuation
Annualized growth rates are useful for predicting the future cash flows of a company. However, they need to be analyzed in detail. In the example above, there is a big difference in the annualized growth and year-on-year growth rates. If the year-on-year growth rate in the latest year is only 9.1%, analysts need to look at the reasons behind this drop and the likelihood of sales growing at 21.5% (the annualized growth rate) in the future.
In such cases, it is vital to understand what is driving these numbers. This can be done by a thorough review of the management discussion and analysis (MD&A), footnotes, and business presentations to investors and analysts. Understanding the drivers of the business is key to establishing a reasonable sales forecast. Using the historical annualized growth rate, without analysis, is likely to overstate future growth in sales for this business.
Annualized Returns in LBO Transactions
A leveraged buyout (LBO) is a financial transaction involving an acquisition by a financial sponsor, financed using significant amounts of debt. Leverage is used to increase the return to equity holders and is repaid from the company’s operational cash flows. Private equity funds expect to exit the investment within a five-year horizon to monetize their returns. The Internal Rate of Return (IRR) is used to evaluate such transactions. An IRR compares the equity investment upon exit versus the equity investment at entry and calculates an annualized return on the investment.
In the case where there are only two cash flows (the original investment and the exit value), the IRR is calculated using the Compound Annual Growth Rate (CAGR) as follows:
(Equity at exit/equity at entry)^(1/number of time periods) – 1
The CAGR formula is useful here as we want to calculate the annual growth rate of an investment over a specified number of years. There could be highs or lows during the investment period, but what matters to the investor is the average return earned over time.
If there are more than two cash flows (for example, interim dividends), we cannot use the above CAGR formula to calculate annualized returns. In such scenarios, we need to use the IRR function in Excel.
Example: Calculating CAGR in an LBO Transaction
Based on the information given below, we have been asked to calculate the CAGR for the following LBO transaction.
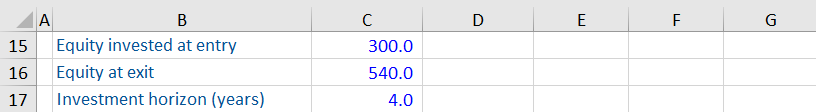
The CAGR or annualized return on this investment is calculated as follows:
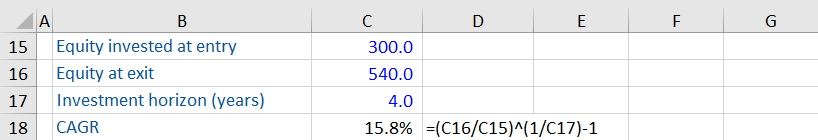
As you can see, this transaction gives an annualized return of 15.8%.
This is a very simplified illustration of an LBO transaction. In practice, there are several variables that could affect the equity invested at entry and the equity at exit. For example, if the transaction is financed using a higher amount of debt, the equity invested at entry will reduce, thus increasing the CAGR. If the EBITDA at exit is higher, it could increase the equity value at exit and again increase the CAGR.
CAGR helps in comparing these different scenarios and helps in evaluating LBO transactions using different assumptions.