


Leverage Ratios
November 20, 2024
What are Leverage Ratios?
Leverage ratios typically either measure the proportion of a company’s debt relative to another financial item (for example equity or total financing), or the company’s ability to support interest payments or principal repayments on its outstanding debt. They are often compared to an industry benchmark as an indicator of how levered (or geared) the company is.
Leverage ratios are used by lenders, valuation analysts, management, and investors to guide their decision-making process. They are used to make comparisons across industry peers and historical data of the same company. Depending on their role, they can use the findings of this benchmarking exercise to decide whether it is prudent to invest in, or provide debt financing to a company, or alternatively, whether the business has the capacity to take on new debt.
Leverage ratios also help lenders control risk in relation to loan agreements. For example, lenders may set maximum limits for leverage ratios in their credit agreements. If borrowers breach those limits, lenders may put restrictions on certain actions such as paying dividends or raising more debt. In addition, banks are required to comply with a leverage ratio, which is designed to prevent excessive build-up of balance sheet risk in the banking system.
Key Learning Points
- Leverage ratios are used to measure a company’s debt-to-equity ratio and its ability to support debt financing
- Leverage ratios are used by lenders, valuation analysts, management, and investors to guide their decision-making process
- Key leverage ratios are, debt-to-EBITDA ratio, debt-to-equity ratio, debt-to-capital ratio, and age ratio
- The characteristics of the business, industry, and sentiment in the credit markets drive acceptable levels of leverage ratios
How is Leverage Created?
Leverage is a strategy where companies use debt to fuel growth. A company will become ‘leveraged’ by taking some form of credit or borrowing and using this capital to increase the potential returns of the company or an investment. The company bets that the returns will outweigh the cost of borrowing. Typically companies would seek additional debt when interest rates are low, so debt repayments are relatively low and therefore attractive.
A company may be growing and may choose to borrow capital from a lender to fund production line expansion plans. This will allow it to accelerate its growth plans whilst being aware that it needs to use its business profits to repay the debt and any interest owing over the period.
Leverage ratios will also be a consideration if a company’s profits are shrinking and its debt will continue to need servicing. If the debt burden is becoming too high this should be visible in the leverage ratios.
How to Calculate Leverage Ratio
There are five widely used metrics related to leverage:
- Net debt = Total interest-bearing liabilities – Highly liquid financial assets
- Debt to EBITDA = Debt / EBITDA
- Debt to Equity Ratio = Debt / Equity
- Debt to Capital Ratio = Debt / (Debt + Equity).
- Interest Coverage Ratio = EBITDA / Interest Expense
Net Debt
Net debt is the debt owed by a company, net of any highly liquid financial assets.
Net debt = Total interest-bearing liabilities – Highly liquid financial assets
Net debt is typically calculated as long-term + short-term debt (and any other debt-like components) – cash and any cash equivalents.
Using net debt to assess a company’s leverage position as it looks at the overall value of the debt taking into account what cash the company has to hand, which it could use to repay the debt if needed.
Debt to EBITDA Ratio
The debt to EBITDA ratio analyses the relationship between a company’s debt and its earnings before the impact of depreciation and amortization. It is used to assess a company’s ability to service its debt. A low debt to EBITDA indicates the company’s debt is low in proportion to its earnings, indicating a greater certainty of repayment. Suppose a credit analyst is comparing two companies in the same industry with debt to EBITDA ratios of 10x and 4x respectively. For a prospective lender or an investor, the company with debt at 4 times has lower default risk than a company with debt at 10 times its earnings.
Earnings before interest, taxes, depreciation, and amortization (EBITDA) is used as a measure of earnings when comparing debt with earnings. EBITDA is often used as a proxy for cash available to service debt. However, caution should be taken as even in the least asset-intensive business EBITDA is not a complete proxy for cash flow. Net debt is often substituted for debt to provide a more accurate assessment of the debt owed. A company may have high total debt with adequate cash and liquid assets to pay it off, resulting in a low net debt. In such scenarios, using total debt may mislead stakeholders through a higher leverage ratio.
It is calculated as:
Debt to EBITDA = Debt / EBITDA
Debt to Equity & Debt to Capital Ratio
The debt to equity and debt to capital ratios examine the proportion of debt financing in the capital structure of a business. The debt to equity ratio calculates debt as a percentage of equity financing. The debt to capital (debt plus equity) ratio calculates debt as a percentage of total capital.
The formulas are expressed as:
Debt to equity ratio = Debt / Equity
Debt to capital ratio = Debt / (Debt + Equity)
Both ratios highlight the impact of the leverage effect. In good economic times, a high proportion of debt relative to equity or total capital means return to equity holders are relatively higher than returns generated by the business’s operations. However, in bad economic climates, a higher proportion of debt also means the losses of equity holders are relatively higher.
Debt to Equity Ratios Examples
Sectors and industries will typically have different average debt to equity ratios depending on the operational structures. For example, capital-intensive industries such as Utilities or Telecoms might have higher sector ratios because they need to fund expensive infrastructure. On the other hand, Tech companies typically have lower ratios as they require less capital for physical assets. It’s important to always look at a ratio relative to the sector and peer group performance.
Growth prospects – a company with high growth prospects may have a higher debt to equity ratio because it can take on more debt to fuel its growth. Part of this leverage for growth strategy will include careful calculations to make it is able to pay back that debt with higher future earnings.
Interest rates – when interest rates are low, companies might look to increase their debt because it’s relatively cheaper to borrow. This could lead to higher debt to equity ratios. Changes in interest rates can also create opportunities to restructure existing debt into less expensive costs. Companies should always have an active eye on the debt markets and be aware of impending movements in interest rates.
Economic conditions – during economic downturns, companies might seek to reduce debt to lower the risk of being unable to repay the debt. This will improve debt to equity ratios.
Company age – younger companies might have higher debt to equity ratios as they have borrowed capital to grow. In contrast, mature companies might have much lower ratios as they’ve had time to accumulate earnings and pay down debt. This is an important consideration when analyzing leverage ratios. What is a relatively attractive leverage ratio for a growth company with a high debt component may conversely be a warning sign in a mature company that its business is slowing down.
Interest Coverage Ratio
The interest coverage ratio, also known as interest cover, measures a company’s ability to service interest payments. Interest cover is calculated as EBITDA divided by interest expense and can be interpreted as the number of times that company could have paid (or covered) the current period’s interest expense from the current period’s profits.
For example, if a company had EBITDA of 862 and interest expense of 116.5 we can say that it has an interest cover of 7.4x. It generates enough EBITDA to ‘cover’ its interest expenses over 7 times for the current period. This coverage ratio may rise and fall in the changing phases of the company’s life, and also in varying economic conditions.
Highly geared companies often incur high interest payments, and it is important to understand whether a company is able (and will continue to be able) to meet these payments. By comparing a company’s earnings with its current interest burden, lenders can assess whether the company’s earnings can support additional interest payments.
However, it is important that EBITDA is clearly defined by the lender to ensure it fairly represents a company’s cash flows (assuming there are no discrepancies between a company’s earnings and its cash flows). While this would make it easier for borrowers to meet their financial covenants, lenders should be comfortable with such adjustments.
The formula is expressed as:
Interest Coverage Ratio = EBITDA / Interest Expense
Leverage Ratio Calculation Example
Here is some financial data from two companies to understand the calculations and interpretation of leverage ratios. Both companies operate in the same industry. They have different capital structures and thus different interest expenses.

These items can be found in the income statement and balance sheet but may require some adjustment. For example, debt is a total of various debt items such as commercial paper (current liability) and long-term debt (non-current liability). EBITDA needs to be calculated by adding depreciation and amortization (typically most easily identified from the cash flow statement) to EBIT or operating income in the income statement.
For equity, if the company is listed it is better to use the market value and not the book value of equity shown on the balance sheet. The book value is used for accounting purposes and could differ significantly from the market value. Using market values for calculating leverage ratios provides a more accurate representation of the company’s financial position.
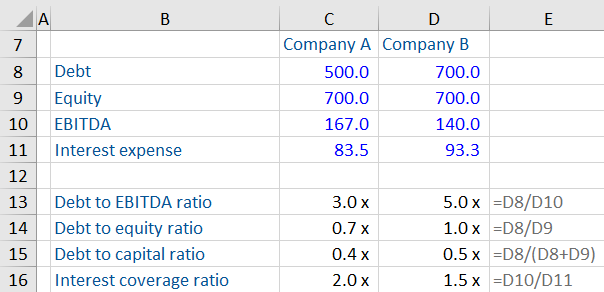
After conducting our leverage ratio analysis, we can see that Company A has a lower debt to EBITDA ratio. Based on this information, as of this date, Company A seems better placed to service its debt obligations. Company A also has a lower debt to equity ratio (debt is 0.71x equity) and a lower debt to capital ratio (debt is 0.4x capital) against Company B.
Company A also has a higher interest cover compared to Company B. Assuming EBITDA is a close proxy for cash flows for both companies, we can infer that Company A has a lower interest burden relative to its earnings.
Leverage ratios should be checked against industry benchmarks. Acceptable levels of leverage ratios vary by business, industry, and the credit sentiment in the market.
Download the Leverage Ratio Template and complete the example question in your own time. The template can them be used to analyze further companies and create more comparisons of leverage ratios.
Conclusion
Leverage ratios are vital when analyzing a company or investment to assess the level of debt incumbent in the company. Put these ratios into the context of a peer group or industry average, analysts can start to assess how likely a company is to continue to service its debt. This can also be used to gauge how much additional debt a company can successfully manage to take on to improve its financial returns. (Or what debt it needs to focus on repaying to keep the business operating.)
Leverage ratios are an excellent barometer of a company’s growth and ability to use its profit and cash flows to service debt. Credit agencies and lenders will insist that ratios as within certain thresholds of acceptability before rating debt or allowing companies to access more capital.