
Rebasing Stock Price to 100
Send download link to:
Recommended Course

Rebasing Stock Prices to 100
June 17, 2022
Comparing relative stock price performances over time periods can be tricky. They have different starting prices, meaning a direct comparison on a graph is difficult. Rebasing them to the same starting point allows for quick comparison and it’s easy to do.
Key Learning Points
- Comparing stock prices over time, when they have different starting points can be difficult.
- Getting a common starting point allows for better comparison.
- Choosing a base number such as 100.0 is a common starting point.
- All movements of the stock prices are then viewed as movements from 100.0, seeing a relative performance is easier, and allows for easy charting.
Rebasing a Stock Price
Rebasing stock prices back to the same starting point allows for a better comparison of performance over a period of time. Imagine having a car race but the cars started at different points and ended at different points – how would you tell which had traveled the furthest or which was the fastest? Rebasing brings the cars back to the same start line.
Imagine two companies have the following stock prices:
- Ford 15.0
- General Electric 200.0
And then those stock prices move to:
- Ford 16.0
- General Electric 210.0
It’s tricky to see that Ford has performed better than GE. But if we rebased them to 100.0 we would see the following movements over this specific period of time.
- Ford 100.0 increases to 106.7
- General Electric 100.0 increases to 105.0
It is now clearer to see that Ford has had superior performance. We can do this for many stock prices and compare their relative position.
How to do it?
To rebase, all stock prices are reset to a base figure, commonly 100. When the stock price moves, it is rebased relative to 100. The formula is:
- 100 x (Stock Price Now / Starting Stock Price)
Using the stock price of Ford and GE above, the calculations would be:
- Ford 100 x (16.0 / 15.0) = 106.7
- General Electric 0 x (210.0 / 200.0) = 105.0
Rebasing Stock Prices Over Time and Graphing
We can use Excel to rebase stock prices over time and then chart how two companies have performed against each other.
Here we have the stock prices of Ford and General Electric over 6 days. They have then been rebased to 100:
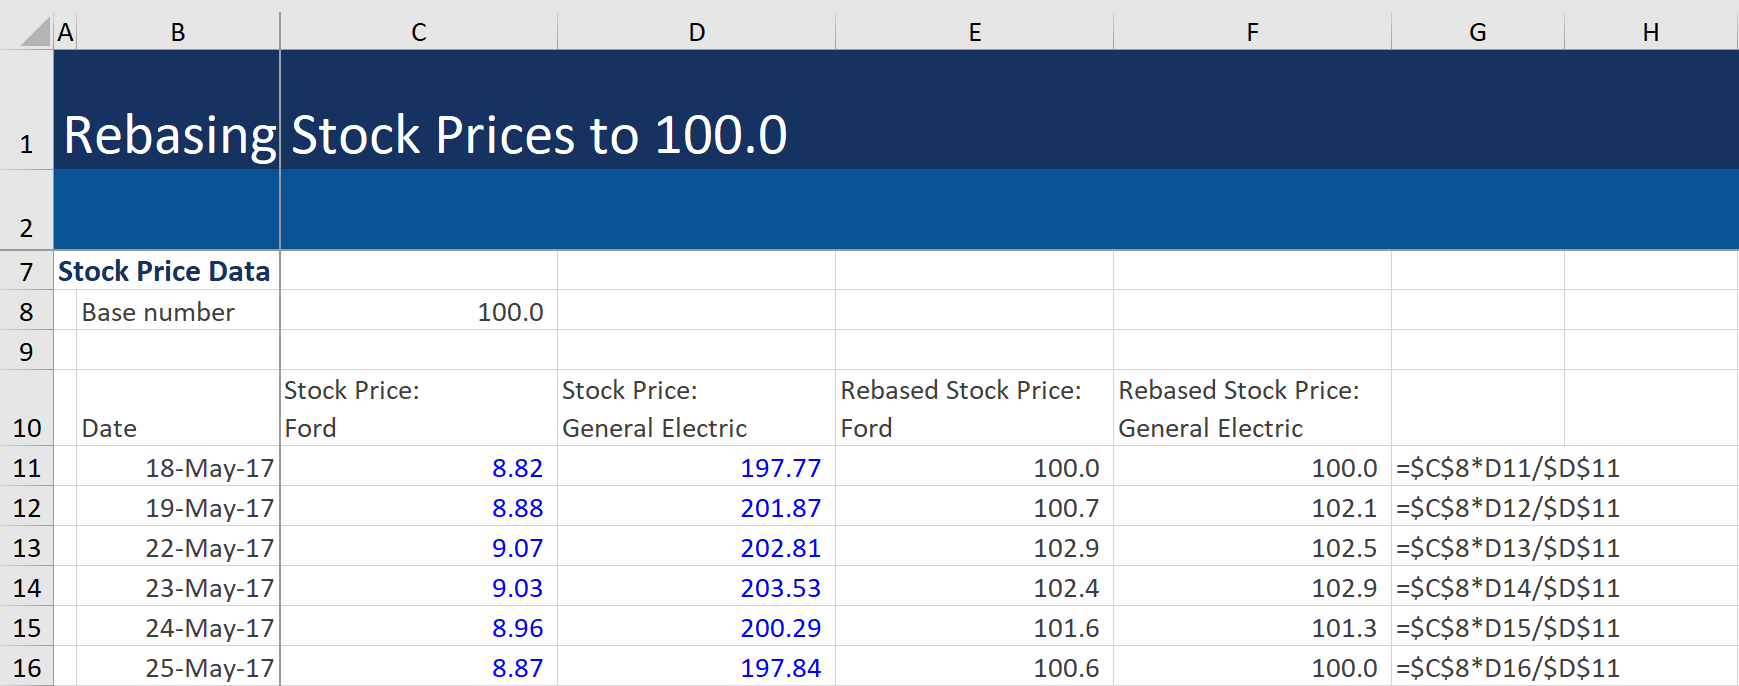
The rebasing formula for General Electric in cell F12 above is: 100.0 x 201.87 / 197.77 = 102.1
We can then do it over a longer period (below is for 5 years), and then chart the relative performance.

Ford has clearly performed better than General Electric, with a rebased stock price that has increased to between 150.0 – 200.0, whereas General Electric has dropped to around 50.0. Rebasing can be done over any period of time and can be particularly useful for assessing year-to-date performance of stocks. This technique can also be used to compare a stock to sector indexes or market performances by rebasing each to 100.0. We can also compare a stock price such as Ford to the Autos Sector if a suitable index is available, or the overall US market.
How to Create the Graph
Select the data in cells B10:F1250 (this includes the 5 years of stock price data and the rebased stock prices), then in the ribbon go to Insert, Line Graph:

This will include the original stock prices, so remove them by right-clicking on the graph, choosing Select Data, and uncheck the “Stock Price: Ford” and “Stock Price: General Electric”

And now the graph is rebased. Charts such as the one below are useful in identifying periods where one stock may have significantly outperformed relative to the other stock. Perhaps a movement in the oil price may have accelerated one stock price performance, and had a negative impact on another stock price. By rebasing stock prices we can look closer at relative performance.

Another use of this process is that it could enable an analyst to look at the performance of the same stock over two time periods. For instance, we could look at General Electric’s performance during the two recession periods. Once we have identified the start of each recession period, we can rebase the stock price to 100.0 for each time frame and compare the relative performances. This can be helpful in examining how closely a stock is following historical stock price patterns.