


Efficiency Ratio
December 17, 2021
What is the “Bank Efficiency Ratio”?
The bank efficiency ratio is a key performance metric used to assess a bank’s profitability. It is calculated by dividing a bank’s operating expenses by its total income and is therefore also referred to as a bank’s “Cost to Income Ratio”.
This metric is important as it provides a guide as to how efficiently a bank is managing its cost base; thereby providing a gauge as to the proportion of operating expenses incurred for each dollar of income generated. Banks aim to keep this metric as low as possible and often disclose a target rate in their financial statements – this target is typically 50-60%.
A bank’s operating expenses are composed of staff costs and infrastructure costs (which relate to office space and tech equipment). These costs are typically stable over time, whilst a bank’s income tends to vary each year depending on economic conditions. This can make the metric quite volatile, particularly if a bank’s income drops significantly from one year to the next.
Key Learning Points
- The bank efficiency ratio is a key performance metric when assessing a bank’s profitability
- The metric divides a bank’s operating expenses by its total income, allowing us to understand its cost-efficiency. Banks aim to keep this metric as low as possible
- Bank’s operating expenses are typically quite fixed in nature whereas their income depends on economic conditions. The metric can therefore be quite volatile
- Banks often disclose the efficiency ratio in their financial statements, but sometimes exclude certain items of income or expense from their calculation
Calculating the Efficiency Ratio
The efficiency ratio is calculated by dividing a bank’s operating expenses (sometimes referred to as ‘non-interest expense’) by its total income, as shown in the formula below:
Banks usually disclose the metric in their financial statements but often make proprietary adjustments to the operating expenses or income measures included in their calculation.
Therefore, analysts often calculate the metric using the standardized formula above, to ensure that they have a consistent ratio that can be used to compare peer banks.
Below is an extract of a bank’s income statement:
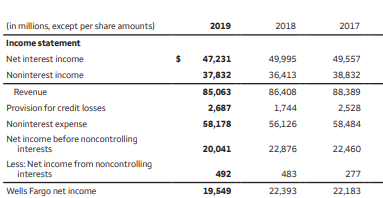
Extract from Wells Fargo Plc Consolidated Income Statement for the year ended December 31, 2019
-Total income was $85,063m in 2019, which is a 1.1% decrease in total income in 2018
-Operating expenses were $58,178m in 2019, which is a 3.7% increase on operating expenses in 2018
-We can use this information to calculate Wells Fargo’s efficiency ratio, which was 68.4% in 2019 compared with 65.2% in 2018
-Wells Fargo’s efficiency ratio has deteriorated in 2019 reflecting the fact that although total income has decreased, the operating expenses have increased. As highlighted previously, the fixed cost base of a bank often means that this ratio increases when a bank’s income is falling
Example
Based on the information below, we have been asked to compare the cost efficiency of Bank A and Bank B.
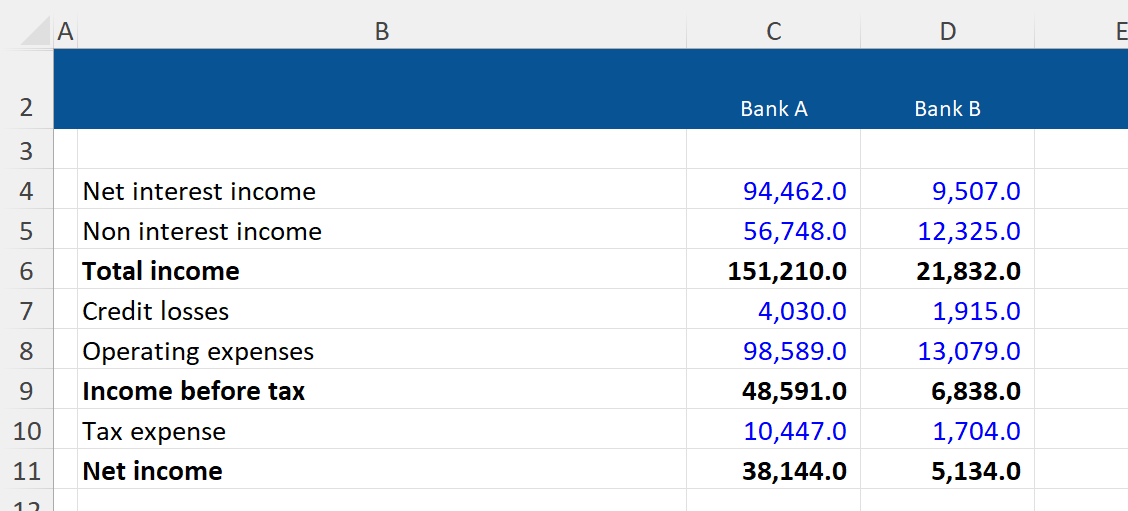
It isn’t easy to compare the cost efficiency of these two banks simply by looking at their income statements as Bank A has generated much larger amounts of income than Bank B but also has much larger operating expenses.
However, when we calculate their efficiency ratios we can get a clearer view of how they compare:
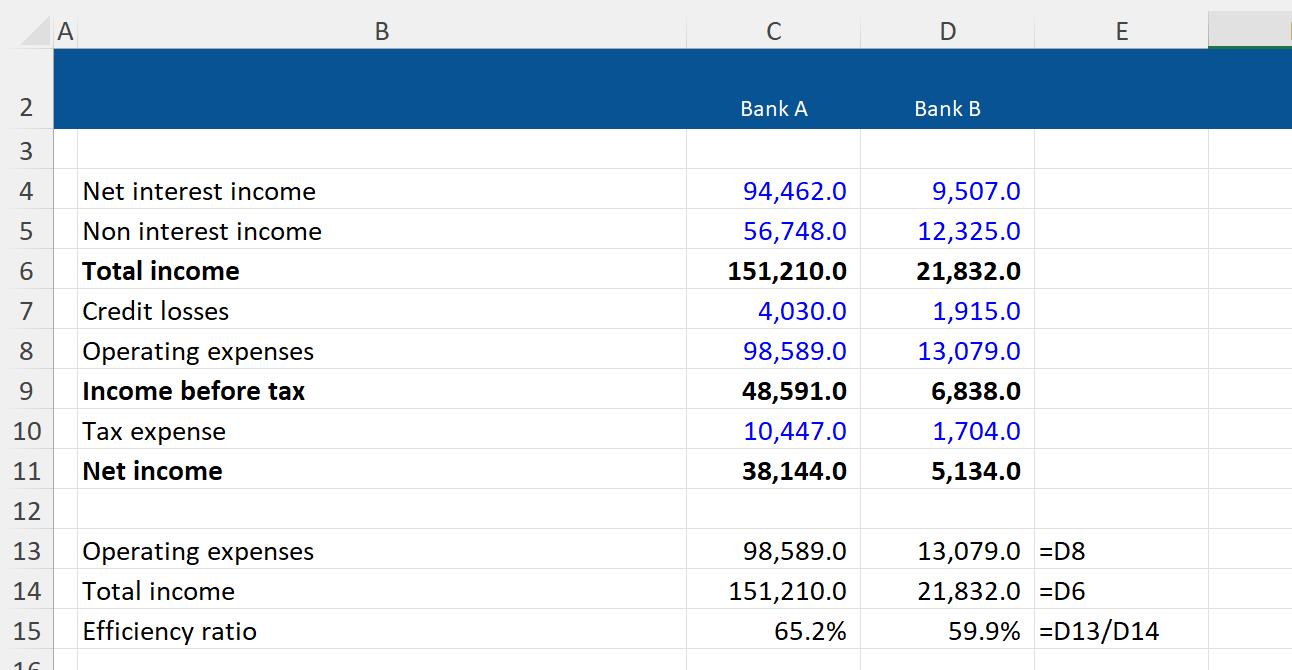
The efficiency ratio for Bank B is lower than for Bank A. This suggests that Bank B is managing its costs more efficiently.
It’s worth noting that our calculation excludes credit losses incurred during the year that are significant for Bank B relative to their net interest income. This serves as a useful reminder that it is important to use a range of metrics when assessing and comparing a bank’s performance.