
Price-to-Book Ratio Workout
Send download link to:
Featured Product

Price-to-Book Ratio (P/B Ratio)
November 19, 2020
What is the P/B Ratio?
The Price-to-Book ratio, or P/B ratio, measures the relationship of a company’s market capitalization to its book value on a per-share basis. It is a balance sheet multiple and compares the market value of a business relative to its book value of equity.
It is a valuation multiple and is often used in comparable company analysis for balance sheet driven companies (banks, real estate and insurance).
Key Learning Points
- The P/B ratio compares a company’s market capitalization to its equity book value
- It is a balance sheet multiple and is commonly used to analyze balance sheet driven companies (banks, insurance and real estate)
- Market capitalization is consistent with equity book value and both are affected by a company’s capital structure
- The ratio is calculated by dividing the share price by the book value per share
- There is a strong correlation between a bank’s P/B ratio and its ROE
Price to Book Ratio Formula (P/B)
The P/B ratio is calculated by dividing market capitalization by the equity book value.
P/B Ratio = Market Capitalization / Equity Book Value
or
Share Price / Equity Book Value per Share
Book value represents the value of assets and liabilities at the date they are reported in a company’s financial statements. The equity book value is the residual claim to shareholders if all assets were liquidated and all liabilities settled.
To calculate the book value per share, the equity book value is divided by the number of shares outstanding. This is typically the diluted shares outstanding.
Book Value per Share = Equity Book Value / Diluted Shares outstanding
Shares outstanding is the number of shares issued by the company minus any shares held as treasury stock. This number is available in the company’s most recent filing and should be adjusted as if all dilutive contracts were exercised.
It is important to calculate a consistent multiple – if the company has more than one class of shares, the P/B multiple can be calculated using only common or ordinary equity (both market and book value), or including all classes of share capital. In the case of multiple share classes, the market value of these needs to be included in the Equity Book Value, even if they are unlisted.
What is a Good Price to Book Ratio?
Assigning a definitive “good” value to the price-to-book (P/B) ratio for stock valuation is challenging. A general P/B range is useful, but it’s essential to also weigh other factors and valuation metrics for a more nuanced interpretation of P/B and a company’s growth prospects.
Long favored by value investors, the P/B ratio is a staple in market analysis. Typically, a P/B ratio below 1.0 signals a potentially undervalued stock to value investors. Yet, some may accept a P/B ratio up to 3.0 as a benchmark for potential investment.
Calculate Price to Book Ratio (P/B) Excel Example
Calculate the P/E ratio, P/BV and P/TNAV (tangible net asset value) ratio of Seine Bank SA and comment on its valuation.
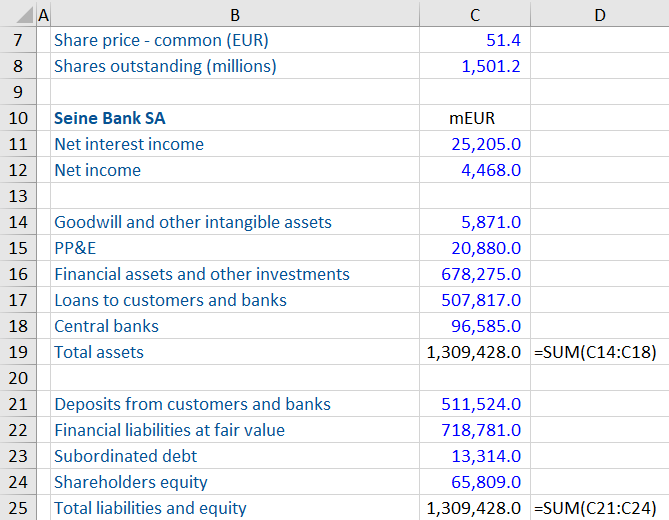
The information above presents the balance sheet and additional information on shares.
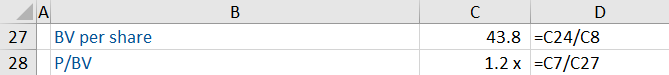
The first step is to identify the relevant information needed for the calculation. As this is a balance sheet, it includes many items which can be ignored. The first sub calculation is to calculate the book value per share. This is calculated as the shareholders’ equity (C24) divided by the share count (C8). This equals 43.8. The company has no dilutive instruments outstanding.
The P/B ratio can now be calculated. The share price is given as 51.4 (C7), and this is divided by the book value per share of 43.8.
The P/B for this bank is 1.2 x.
Download the Excel workout to see the calculations for the P/E ratio and P/TNAV ratio.
Analyzing the P/B Ratio
The P/B ratio should only be used where the balance sheet equity is a suitable value driver – typically only for financial and REIT companies as the balance sheet assets and liabilities are usually recorded at market values. These are therefore a good predictor of share prices.
Like all multiples, P/B is sensitive to expectations of growth, returns and risk (i.e. cost of equity). Therefore when comparing P/B ratios, we should ensure that the comparable companies exhibit similar levels of growth, returns and risk.