Price Level Indicators Workout
Send download link to:
Featured Online Resource

Price Level Indicators
September 10, 2021
What are “Price Level Indicators?”
Price level indicators reflect the general level of prices for goods and services in an economy and measures the changes over time. The three major price level indicators that economists and policymakers often refer to are, the Consumer Price Index (CPI), GDP deflator, and the Producer Price Index (PPI). These indicators are used by central banks to monitor inflation levels in their respective economies.
Participants in financial markets and those involved in investments are also very interested in the movement of these price level indicators and their possible future trajectories, given the impact on monetary policy decisions (i.e. setting of interest rates by central banks) – which in turn has an impact on their investment returns.
Key Learning Points
- These three price level indicators are used to calculate the inflation rate (%) – annual, quarterly or monthly.
- Since low inflation is good for stimulating the economy and the stock market, these price level indicators are monitored closely.
Price Level Indicators – Types
The first price level indicator is CPI which is a measure of the average monthly change in the price of goods and services paid by urban consumers (which constitute most consumers) of an economy between any two time periods. This index includes virtually every sector of food, clothing, shelter, fuels, transportation, fares, and sales taxes. The United Nations divides individual consumption items consumed by urban consumers in an economy according to the purpose (COICOP) into 12 broad categories.
Prices in the household consumption items are collected every month. The CPI is used to recognize periods of inflation and deflation in an economy.
The formula for calculation of inflation (%) in terms of the CPI:
Inflation Rate (t) = (CPI (t) – CPI (t-1)) X 100/CPI (t-1)
t= Period (year, quarter or month)
The calculation of the inflation rate (on the CPI measure) shows us by how much more (%) does the average household or consumer in any country have to pay in any given period – year, quarter or month – compared to the previous year, quarter or month respectively.
The second price level indicator is the GDP Deflator which is an indicator of the overall inflation in an economy, as it reflects changes in prices of all goods and services included in the GDP of a country (i.e. changes in prices of domestically produced output). It does not reflect import prices, unlike the CPI. Basically, the GDP deflator is a broader measure of inflation than CPI. Unfortunately, this measure of inflation is not of much use for policymaking, as it’s available only after a very substantial lag. This undermines its usefulness.
The GDP deflator is defined as the ratio of nominal GDP to real GDP i.e. Nominal GDP/Real GDP. It might be noted that changes in nominal GDP reflect changes in both output and prices, whereas changes in real GDP reflect changes in output only (which is what truly or really matters).
GDP Deflator (t) = Nominal GDP (t)/Real GDP(t) * 100
t= Period (year, quarter, or month)
The third price level indicator is the Producer Price Index (PPI), this index captures the price movements of goods and services at the wholesale level in an economy and measures average change in selling prices received by domestic producers for their output. It is used as an indicator of future price changes at the retail level and is useful in predicting changes in the CPI.
Formula for calculation of inflation (%) in terms of PPI:
Inflation rate (t) = PPI (t) – PPI (t-1)/ PPI(t-1) *100
t= Period (year, quarter, or month)
To calculate inflation on the PPI measure, we compute the percentage (%) change in producer prices between some previous periods (for example, the PPI in March 2020 or June 2019).
Low inflation is good for stimulating the economy and particularly consumer spending, corporate profits, and ultimately the stock market. This is why these price level indicators are closely monitored.
CPI and GDP Deflator, Example
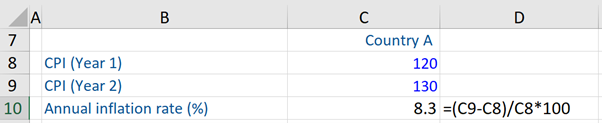
In the first example, the CPI for the years 1 and 2 (Country A) is given and the annual inflation rate (8.3%) is calculated using the CPI formula.
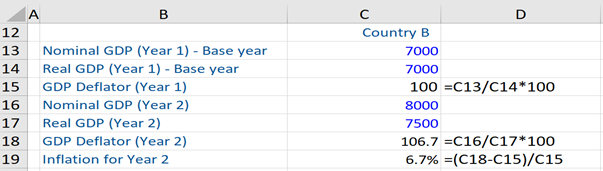
In this example, the Base year (1) values of nominal and real GDP for Country B are given. Thereafter, the GDP deflator for year 1 is calculated. Then, the GDP deflator for year 2 is computed. Finally, based on the GDP deflator of year 1 and year 2, the inflation rate for year 2 is calculated (6.7%).