


Security Market Line
September 1, 2021
What is the “Security Market Line?”
The Security Market Line (SML) is a graphical representation of the Capital Asset Pricing Model (CAPM) and shows the expected return for an asset, for each level of risk.
It is used by investors to evaluate or determine whether a security should be included or not, potentially in a portfolio, depending on whether that security offers a favorable expected return against its level of risk. The CAPM and the SML are functions that provide us with an indication of what the return in the market or security should be, given a certain level of risk. However, the actual return may differ from this expected return.
Key Learning Points
- Since the SML is a graphical representation of CAPM, its formula is essentially the same as the latter;
- The SML, which is upward sloping, shows the expected return on an asset for each level of risk.
- The securities that appear on the left (right) side of the SML are considered undervalued (overvalued).
Security Market Line – Formula
The SML formula is essentially the CAPM formula and equals it, as it is a graphical representation of this model.
Security Market Line (SML) = E(Ri) = Rf + Bi*(ERm – Rf)
E(Ri) = Required or expected return on an asset
Rf = Risk-free rate
Bi = Beta of an investment
ERm = relates to expected return in the market
(ERm – Rf) = Risk Premium for taking on equity risk
The systematic or market risk is measured by the beta. This is the part of the risk explained by a company’s exposure to market factors i.e. interest rates, economic growth, etc. It might be noted that the CAPM and therefore the SML is based on the idea that only systematic risk should affect asset prices.
Having stated the above, the SML is a graphical representation of the CAPM, which has the systematic risk or beta of investment on the x-axis and the expected or required return for the asset on the Y-axis. Such a graph shows the expected return for each level of risk.
The Y-intercept is the risk-free rate and the slope of the SML is the market risk premium (i.e. (ERm – Rf)). The slope of the SML is upward sloping as the higher (lower) return is associated with higher (lower) risk.
When securities are plotted on an SML chart and if they appear above the upward sloping SML (i.e. to the left of the SML), then these securities are considered “undervalued”, in price as the same are expected to produce a return that is higher than its risk would indicate as measured by beta.
On the other hand, if a security or securities plot below the upward slowing SML (i.e. to the right of the SML), then the same is considered “overvalued’ in price because the expected return does not meet the required return for the level of risk taken.
Importantly, if a security plot on the SML, an investor is expected to receive the appropriate level of return for the level of risk taken, and therefore the security is neither undervalued nor overvalued i.e. it is appropriately valued.
Security Market Line, Overvalued and Undervalued Securities
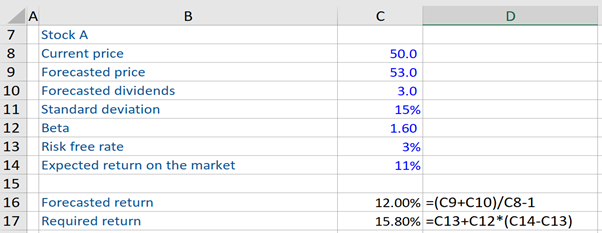
In the first example, given below is information pertaining to stock A. We have to determine if this stock is undervalued or overvalued, based on the forecast model. Here, we first calculate the forecasted return of stock A, using the forecast model, and then compute the required return. Thereafter, we compare both values. Now, since the required return of stock A (i.e. 15.80%) is greater than the forecasted return (12.0%) on the same, this stock is overvalued.
Since this stock is overvalued, it plots below the SML (i.e. to the right of the SML.)
In the second example, we follow the same procedure to compute the forecasted return and the required return of stock B and compare the two. Here, we see that the required return of stock B is lower (10.20%) than the forecasted return (12.79%) on the same. Therefore, stock B is undervalued. Since this stock is undervalued, it plots above the SML (i.e. to the left of the SML.).
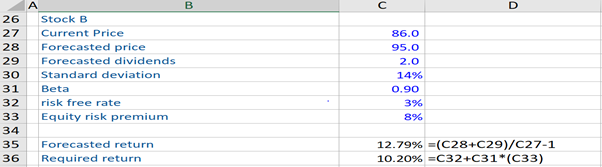
Lastly, stock B has a significantly lower expected or required return, when compared to Stock A, even though the standard deviation of both stocks is similar. Stock B has a beta of less than 1, so it is considered a defensive stock. Consequently, it has a lower expected return, compared to stock A.