Stock Prices
April 27, 2021
What are “Stock Prices”?
Suppose an investor wants to purchase the stock of a publicly traded Company XYZ on a stock market (e.g. NYSE or FTSE 100), then the amount he or she would have to pay for the stock (e.g. US$20) is referred to as the “stock price” of that company. With reference to stock prices, there are two important terms – “Market Value” and “Par Value”.
The market value of a Company XYZ stock is the price (e.g. US$150) at which the stock of a publicly-traded company is bought and sold on a stock market (more specifically, in the ‘secondary market’). It tends to fluctuate as investors purchase and sell stocks and is affected by market conditions. When we talk about stock prices, we usually refer to the current price that a stock is trading for on a stock market.
To trade stocks, there is a ‘bid’ price – this is the amount a buyer is willing to pay to purchase a stock. There is also an ‘ask’ or ‘offer’ price, which is the price a seller is willing to accept to sell the shares. The difference between these two prices is known as the ‘bid-ask spread’ and is an opportunity to make money when dealing with stock markets. Prices are ‘quoted’ on trading systems to help facilitate the buying and selling of stock.
If a stock is large and ‘highly liquid’ (meaning it is traded frequently and in high volumes) then this spread is typically small as there are plenty of buyers and sellers in the market. If a stock is smaller or ‘illiquid’ (traded less frequently or small volume) then the bid-ask spread can widen as the market has to ‘match’ relatively fewer buyers with fewer sellers and this can take time. The benefit of being a listed company rather than privately owned is that stock is regularly traded so there is a closer relationship between the management of the company and those who may wish to buy or sell shares.
The par value is the original price of the stock of a company (e.g. US$10). It is simply the nominal price of a stock at the time that the share classes were determined. The par value remains unaffected by market conditions. Once a stock is listed on the stock market (known as an Initial Public Offering or IPO) it is then traded in the secondary market where buyers and sellers meet.
Key Learning Points
- Stocks have ‘bid’ and ‘ask’ prices and the difference is known as the bid-offer spread
- The ‘share premium” refers to the difference between the market (or current) price of that stock and its par value
- Stock prices are influenced by demand and supply in the short term
- Beyond the short-term, they are determined by a company’s fundamentals and other factors such as economic cycle and the wider macro environment (including political factors etc)
- Stocks can be overvalued or undervalued which refers to situations where stock prices are deemed higher or lower than what the underlying company is worth
- The intrinsic value of a stock is what it is actually worth. This can be determined by analysis methods such as the Dividend Discount Model, Discounted Cash Flow Analysis, using the Price Earning (P/E) ratio and Asset-based Valuation
- A variant of the Dividend Discount Model, known as the Gordon Growth Model, can be used to calculate the intrinsic value of a stock
Stock Prices – Share Premium, Valuation and Intrinsic Value
If the market or current price of a stock is US$150 and the par value of the same is US$10, and the investor has to pay US$150 to purchase the same, then he or she has paid a share premium of US$140 for that stock. (There are also additional costs and taxes associated with purchasing stock which are in addition to the quoted stock price.)
Stock prices are impacted by many factors. In the short term, demand and supply play a significant role in determining the price. If lots of investors are interested in a company then they may be willing to pay more to acquire it (pushing the price up), or perhaps lots of stock owners will look to sell at the same time and thus accept a lower price to do this (pulling the price down).
Beyond the short term, there are fundamental factors such as a company’s profitability and earnings growth prospects, along with investor confidence. Stock prices are also impacted by factors such as the state of a country’s economy and outlook, the economic cycle, geopolitical factors, developments in the global economy, inflation, interest rates, government policies, political stability and declaration of dividends.
Stocks can be overvalued or undervalued. If the stock of Company XYZ is selling at a price which is much higher (or lower) than what it is actually worth, such a stock is termed as overvalued (or conversely undervalued). Whether a stock is higher or lower than what it is actually worth can be determined predicated on analysis of fundamentals such as earnings and growth intrinsic value prospects of the company.
In addition to the value of a stock that is reflected in its current or market price, there is the concept of intrinsic value. This can be determined by methods such as Dividend Discount Model, Discounted Cash Flow Analysis, using the Price Earning (P/E) ratio of a stock, and Asset based Valuation among other others.
Determining the intrinsic value of a stock and comparing it with the market price of peers can help enable investors to decide if a stock is overvalued or undervalued. For profitable investments, one should always look to purchase stocks where prices are lower than what they are actually worth (intrinsic value) i.e. buy those stocks that are undervalued.
Determining the Intrinsic Value of a Stock
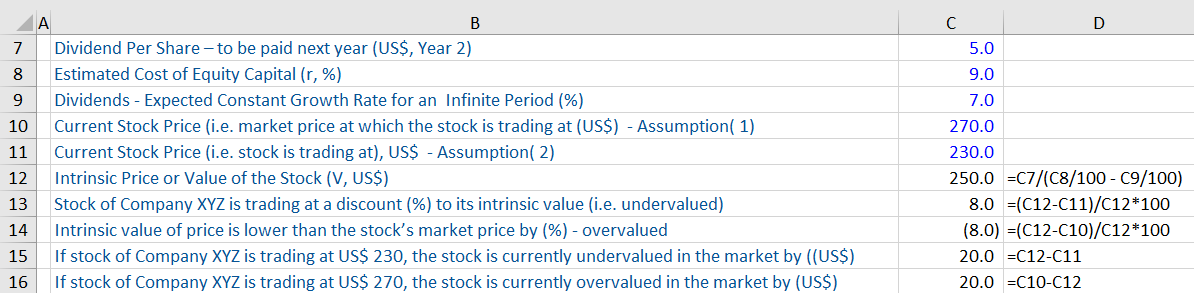
Given below is a workout of the calculation of the intrinsic value of a stock, to determine whether it is overvalued or undervalued, using a variant of the Dividend Discount Model (DDM) known as the Gordon Growth Model. This model is a relatively easy method to calculate the intrinsic value of a stock.
Essentially, the DDM is a method by which we value a company based on the assumption that its stock is worth the discounted sum of all the dividend payments that a company will make in the future.
The formula of the Cordon Growth Model is:
IV(P) =D (Year 2) /(r-g)
Where:
IV(P) = Intrinsic value of a stock of a company (XYZ)
D = Dividend to be paid by the company XYZ next year (i.e. year 2)
g= Expected constant growth rate of dividends (of company XYZ) annually for an infinite period
r = Estimated cost of equity capital
Example of this calculation is shown below: