


Horizontal Analysis
September 23, 2021
What is “Horizontal Analysis”?
Horizontal Analysis is an analytical method used to compare financial statements – primarily the balance sheet and income statement – based on historical data, in order to uncover the financial performance of a company or companies over a specified period of time. To conduct horizontal analysis i.e. evaluate underlying trends, it’s essential to compare financial statements of a company or companies over two or more accounting periods.
Carrying out horizontal analysis of the income statement and balance sheet helps investors and creditors to determine the current financial position of a company. By looking at past performance, it can help assess growth rates, spot trends (by comparing changes from period to period), generate forecasts, or project the insights gained into the future. Horizontal analysis can help evaluate a company’s financial standing or position vis-à-vis its competitors.
Key Learning Points
- Horizontal analysis compares the financial performance of a company (or companies) over a given period of time by looking at the historical financial statements
- In horizontal analysis, the year-over-year changes (or alternative) in the line items of the financial statements of a company or between the base year (year 1) and year 3 or more are expressed in absolute terms ($) and in percentages (%)
- It is useful for uncovering trends in the financial performance of a company
- Horizontal analysis is used by investors to help decide whether or not to invest in a particular company
Horizontal Analysis – Formula
In horizontal analysis, the changes in specific items in financial statements i.e. net debt on the balance sheet or revenue on the income statement– are expressed as a percentage and in a specific currency – for example, the U.S. dollar.
The horizontal analysis involves two types of formulas – one to compute percentage change and the other to calculate the absolute change in a specific currency. For example, take the income statement of a company and we can select a line item, e.g. net income. The formula for horizontal analysis will be:
Historical analysis (%) = net income in year 2 – net income in the base year (year 1) / net income in a base year * 100
Note, year 2 is the comparison year. If the comparison year is year 3, then we will input the net income of year 3 and compute the percentage change between year 3 and year 1 (base year).
Horizontal Analysis (US$) = Net income in year 2 – Net income in the base year (year 1)
We use the same formula for other items in the income statement and balance sheet.
These formulas are used to evaluate trends which can either be quarter-on-quarter or year-on-year depending on the accounting period from which the data is sourced. For horizontal analysis, it’s best to take several years of historical data to gain useful insights into how a company is performing. This can help determine what is a clear trend and what may be a one-off event.
Horizontal Analysis – Percentage Change
To perform horizontal analysis vis-à-vis either the income statement or the balance sheet, we will have to first compare the financial results i.e. the change in the line items from one accounting period to the other in order to discern if the change from one period to the other is positive or negative and how strong is the growth or decline.
For example, let’s take the case of the income statement – if the gross profit in year 1 was US$40,000 and in year 2 the gross profit was US$44,000, the difference between the two is $4,000. Here the change is positive and we can calculate the percentage change.
When we use percentage change, it is very useful to carry out a more in-depth analysis and identify trends. In the example above, the percentage change in the gross profit from year 1 to year 2 is calculated as 4,000/40,000 * 100 = 10%.
Using Horizontal Analysis for Forecasting
If we take historical data of the financial statements of a company for year 1 and year 2, then one can compare each item and how it has changed year-over-year. We can use this trend to project the line items for future years.
In other words, one can take year-on-year or quarter-on-quarter growth rates of all the items of the income statement or the balance sheet – based on the historical data. Thereafter, one can make assumptions about the future growth rates. For example, in the income statement, we can, based on historical data and trends, make assumptions about sales growth and then forecast the sales growth rates through the forecast periods.
Horizontal Analysis Example
Given below is a horizontal analysis in excel of a comparative income statement (i.e. year 1 – base, year 2, and year 3). Using the aforesaid formulas, we have computed the absolute change (in US$) and percentage change (%) of all line items in the income statement between year 1 (base year and year 3. This can be viewed from the last two columns and the formulas can be viewed in the Excel spreadsheet. This is the first type of horizontal analysis. This Excel sheet is available in our free downloads.
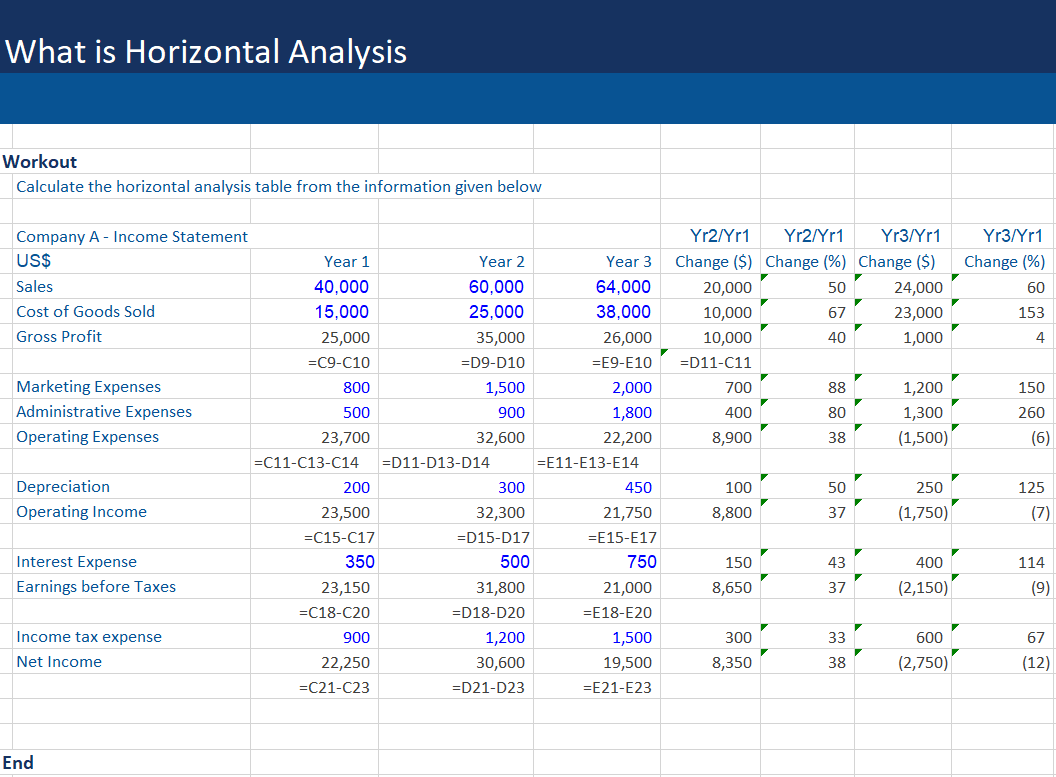
We can now see how much any item, such as net income, increased or decreased from year 1 (base year) to year 3 in absolute and percentage terms. In other words, we can calculate how much net income increased or decreased from year 1 to year 3 (or for that matter any year). Here net income has decreased by $2,750 or 12% in year 3 when compared to year 1.
Secondly, in the second type of horizontal analysis, we are interested in knowing about the underlying trends in the line items of the income statement. For this, we compare the absolute change ($) and percentage change (%) in all the line items from one period to the other. One should ideally take three or more accounting periods/years to identify trends and how a company is performing from one year/accounting period to the next year/accounting period.
Here, for the sake of illustration, we have shown the absolute change (in US$) and percentage change (%) of all line items in the income statement between year 1 and year 2 only. The computations of the same have been done in columns F and H.
Such analysis provides valuable insights into why any of these line items rose or fell sharply or markedly in year 2, compared to year 1. For example, net income could fall sharply in year 2, despite a rise in sales, due to a marked rise in the cost of goods sold, marketing expenses, administrative expenses, and/or depreciation expenses.
This type of analysis is also very useful if an investor wants to determine the performance of a company prior to investing in the same. For example, an investor may want to evaluate the performance of a company over the past year– relative to the base year in order, to decide whether it is worthwhile investing in this company or not.