


Sensitivity Analysis
September 1, 2021
What is “Sensitivity Analysis”?
Sensitivity analysis is a part of an LBO model. It calculates a series of internal rates of return – IRRs or any other output chosen (e.g. money multiple) for a given purchase price and leverage assumption. The levered valuation is established by sensitizing the maximum purchase price for a reasonable range of IRRs – often in the range of 20-25%.
Basically, sensitivity analysis is pivotal for the analysis of IRRs and framing LBO valuation, and can be performed to evaluate how the IRR will be impacted, as a result of a change in different independent variables – while keeping all other assumptions unchanged.
Key Learning Points
- In an LBO model, sensitivity tables are a part of the model outputs
- In sensitivity analysis calculations, the lower purchase price typically generates the higher IRR and the higher purchase price which generates a lower IRR
LBO Model – Main Components
The main components of an LBO model are model inputs, operational forecast, cash sweep, and model outputs. This includes creating credit ratios, calculating the equity IRRs for various groups of shareholders, and performing sensitivity tables. Sensitivity tables may, for example, explore what might happen to the IRRs if an investor were to vary the exit year and then perform a levered valuation.
What Sensitivity Analysis Calculates
Once the model is completed, equity IRRs are sensitized using excel data tables. The typical terms to sensitize for are the exit year assumption, the purchase price, an operating scenario, and the amount of leverage.
Finally, levered valuation is determined by sensitizing the maximum purchase price for a reasonable range of IRRs (often between 20% to 25%). The purchase price is then adjusted either by changing the percentage premium or the EBITDA acquisition multiple, depending on whether the target is public or private. The lower purchase price will typically generate a higher IRR (for example, of 25%) and the higher purchase price will usually generate a lower IRR (for example, of 20%).
Sensitivity Analysis – Example
In the excel table below, we have the current IRR (11.3%) on the top left-hand corner. But this model doesn’t have the circular switch or iterations on. So, once they are turned on (i.e. turn on iterative calculations and go to the info tab and turn that to 1) we now have the current IRR as 10.9% instead of 11.3%.
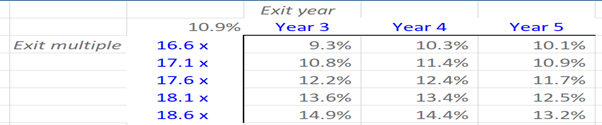
Next, we can put some different factors into the model i.e. instead of having an exiting year 5 (the current exit year), we would like to try exit years 3 and 4. Instead of using an exit multiple of 17.1x, which is the current figure, we would like to use a range of figures.
We can do this using a two-variable or two-factor data table. We can put our output in the top left-hand corner and now apply the data tables (in excel, go to ‘Data’ – ‘what if analysis’ – ‘Data table’). Here we are asked to input the row cells – which are the years 3, 4, and 5 (i.e. the exit years in the rows) – instead of year 5 earlier – and column cells shown in blue (which are the exit multiples 16.6X to 18.6X).
Next, we can run the data table and see that the figures have not changed. We have the original 10.9% IRR when we had year 5 as exit year and 17.1x exit multiple. If we now get an exit in Year 3 and we can see an exit multiple of 18.6x, that would give the highest IRR of 14.9%. However, the IRR is below 20% or 25% – which is the common threshold for an LBO.
Next, let’s go to the second data table. Now, suppose we change the exit multiple and change the premium we are going to pay. Now, we should select the second data table (go to ‘Data’ – ‘What-If’ data table – note: the row is the exit multiple, and then the column is the premium). Our historical exit EBITDA multiple is 17.1x (which is the row input) and the column input is the premium paid (20.0%).
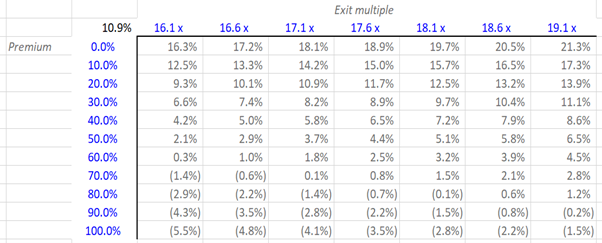
Having done this, we can run the second model, when we had 17.1x (exit multiple) and 20% premium, we had an IRR of 10.9%. Now, if we have an exit multiple that is much higher 19.1x or 18.6x and pays a very low premium, one could achieve an IRR over 20%, i.e. 21.3%.
However, there are a couple of instances, but both of these are quite optimistic – they both assume an exit multiple far higher than the entry multiple and they both assume that the current shareholders of the target company would accept a 0.0% premium.
This is in effect how sensitivity tables can be put together and used to analyze IRRs.
Whether you are interested in Investment Banking, or Private Equity, gain in-depth and hands-on experience modeling out a leveraged buyout transaction by enrolling on our Wall Street recognized online Mergers and Acquisitions Course or online Private Equity course.