
Top-Down Forecasting
October 29, 2021
What is “Top-Down Forecasting”?
Top-down forecasting is a method used for estimating future revenues for a company starting at the very “top”, with high-level or “macro-level” market data. This can be done by starting with the total addressable market (TAM) size in dollars (or another preferred currency) for a company. We can take the implied market share (%) for the company and, and then multiply the TAM. This could then provide a revenue projection for the company.
The top-down method can be used by larger companies that operate in mature industries where TAM data is available and where companies track their Market Share. It can also be applied to early-stage companies that lack historical financials but need to develop a forecast and determine their position in the marketplace. However, the use of top-down forecasting for early-stage companies is viewed as a starting point or a “back of the envelope” type estimate for forecasting revenues. It is important to sense-check when working with top-down forecasting to make sure the estimates are reasonable and within the operating capabilities of the company.
Key Learning Points
- The top-down forecasting method calculates a company’s revenue projection by multiplying the total addressable market (TAM) by the company’s market share percentage
- More established and mature companies often use this method to forecast company revenues or by each business segment
- Early-stage companies that lack any historical financials to forecast future revenues may use the top-down method because it may be the only option available
Top-down forecasting process
Top-down forecasting can be based on reported numbers, if available, or by estimates of market sizes and company market shares. The first step is to research and locate a TAM for a company’s overall business or break it down into two or more business segments. If only a historical figure is available it might be necessary to adjust it for the relevant year by making an assumption. Sometimes overall market data is slower to be collated and released later than company specific data.
The second step is to estimate what market share percentage the company is forecasted to capture in the future. Sometimes a company may have a market share target or be able to guide on its target market share. The final step is to calculate the estimated revenues for a company by multiplying the TAM by the percentage market share.
The total addressable market (TAM) is deemed the entire revenue opportunity in a specific market (country or region) for a product or service. The serviceable addressable market (SAM) is a subset of TAM; it is the percentage of TAM that could “feasibly” or “realistically” represent a potential revenue opportunity for the company.
The opposite of this method is bottom-up forecasting, whereby revenues are estimated by building up from an assumption about the number of customers or units sold and then adding in other factors such as price and product type. The revenues would be derived from these low-level estimates.
Formula
The top-down forecasting for revenues is as follows:
Revenues = TAM Size ($) x Market Share (%)
TAM is the overall size of the market revenue opportunity in dollars (or another preferred currency). Market share is the percentage share of the revenue opportunity that a company can “reasonably” attain.
Example of Top-Down Forecast in a Model
For companies that operate in just one market or where the breakdown of a global market or a large market by segment is not available, the following illustrates the calculation of revenue projections.

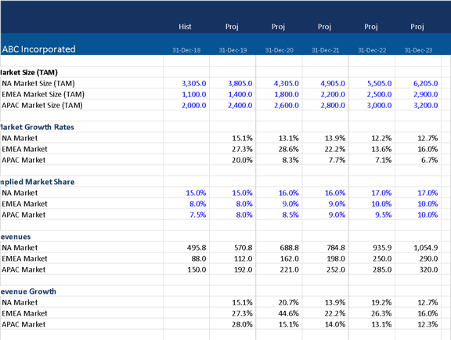
For companies that operate in multiple markets and where such market data exists the following illustrates the calculation of revenue projections by market.