
Inflation Calculator Excel Workout
Send download link to:
Recommended Course

Modelling Inflation
April 1, 2025
What is inflation?
Inflation is the increase in prices over time. In macro-economic terms, it is the effect of excess demand, which has the impact of increasing prices. Over time, this should stimulate greater supply of those products and services, which will bring supply and demand back into equilibrium.
Typically, a financial model is concerned with micro-economic issues – it forecasts the financial outcomes for one business within the larger economy. While individual businesses cannot control inflation, they are subject to its effects. It impacts both revenue (inflation affects how a business sets prices) and costs (the business will pay higher prices to suppliers).
National statistics bureaus compile measures of inflation such as the Cost Price Index (CPI), Retail Price Index (RPI), and Retail Price Index Excluding Housing Costs (RPI-X). These are all measures of historical inflation. The different measures vary depending on which goods and services are included.
To model future inflation for a business, it’s necessary to estimate the inflation rate and apply that to prices and costs in effect today. Note that inflation may impact revenue and costs differently, which will change the business’s profit margin.
Key Learning Points
- Inflation is the increase in prices in an economy.
- Modelling inflation is important because of the impact on cash flows and profit margins.
- We need a simple way to model inflation that is both accurate and flexible.
How is Inflation Calculated?
Inflation is a compound factor, i.e., if inflation this year leads to higher prices, those higher prices are the starting point for next year’s inflation.
For example, if something costs $100 today and inflation is 10% per year:
| Time Period | Cost | Formula |
| Time 0 | $100 | N/A |
| Year 1 | $110 | $100 x 1.10 |
| Year 2 | $121 | $110 x 1.10 |
| Year 3 | $133 | $121 x 1.10 |
| Year 4 | $146 | $133 x 1.10 |
| Year 5 | $161 | $146 x 1.10 |
Notice that this is an exponential line, NOT a straight line. We are not simply adding $10 each year
Plotting the curve:
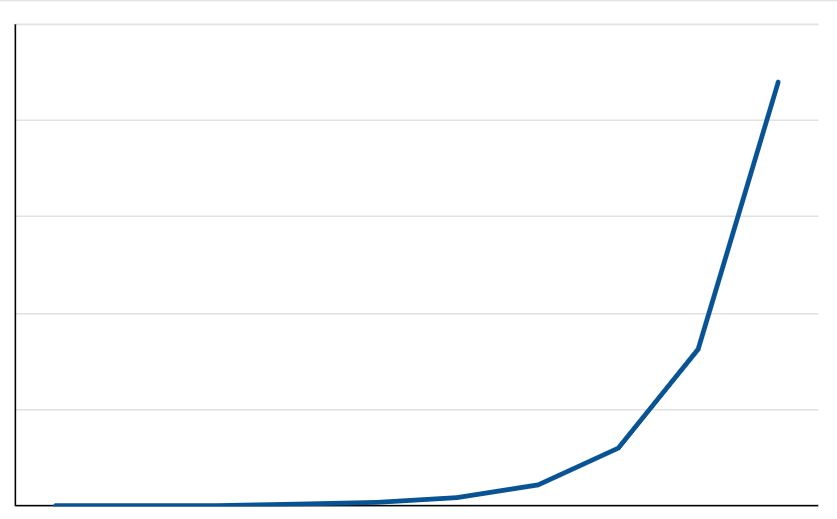
Illustration of an exponential curve
Inflation Rate Formula
The formula to calculate an exponential rise such as inflation is:

P = original price
r = rate of inflation
n = number of periods
Note that the period length is flexible: it could be months, years, weeks – it doesn’t matter, so long as the inflation rate corresponds with the period. For example, if you have a monthly model, use the monthly rate of inflation to the power of the number of months.
Using this formula for the example above:
$100 x (1 + 10%) ^ 5 = $161
How to Add Inflation in Excel
To add inflation to costs or revenues in an Excel model, we use the same formula:

P = original price
r = rate of inflation
n = number of periods
P, r and n are all assumptions about the future, which should be in a separate area of the spreadsheet to make these elements easy to change if necessary.
It is useful to create an inflation index calculated as (1 + r) ^n that can be applied consistently to costs and revenues in each year. The index at 10% is:
| Year 1 | Year 2 | Year 3 | Year 4 | Year 5 | |
| Index | 1.10 | 1.21 | 1.33 | 1.46 | 1.61 |
Download the Inflation Calculator to see this example in Excel. This inflation index is flexible – if we change the inflation input percentage rate “r” (cell D7 in the inflation calculator), the index will update in all the years.
How do we apply this index?
To use the index, simply multiply the original cost at the start of the model by the index:
For an initial cost of $100,000 the inflated costs are calculated as below:
| Year 1 | Year 2 | Year 3 | Year 4 | Year 5 | |
| Index | 1.10 | 1.21 | 1.33 | 1.46 | 1.61 |
| Cost | 110,000 | 121,000 | 133,100 | 146,410 | 161,051 |
If a cost today is $100,000 and inflation is 10%, the future value with inflation in year 5 will be $161,051.
Cumulative Inflation Formula in Excel
The exponential formula automatically includes compounding, ensuring that the impact of inflation is added in every period, forming the base for the next.
Nothing further needs to be done to model the cumulative effect of inflation.
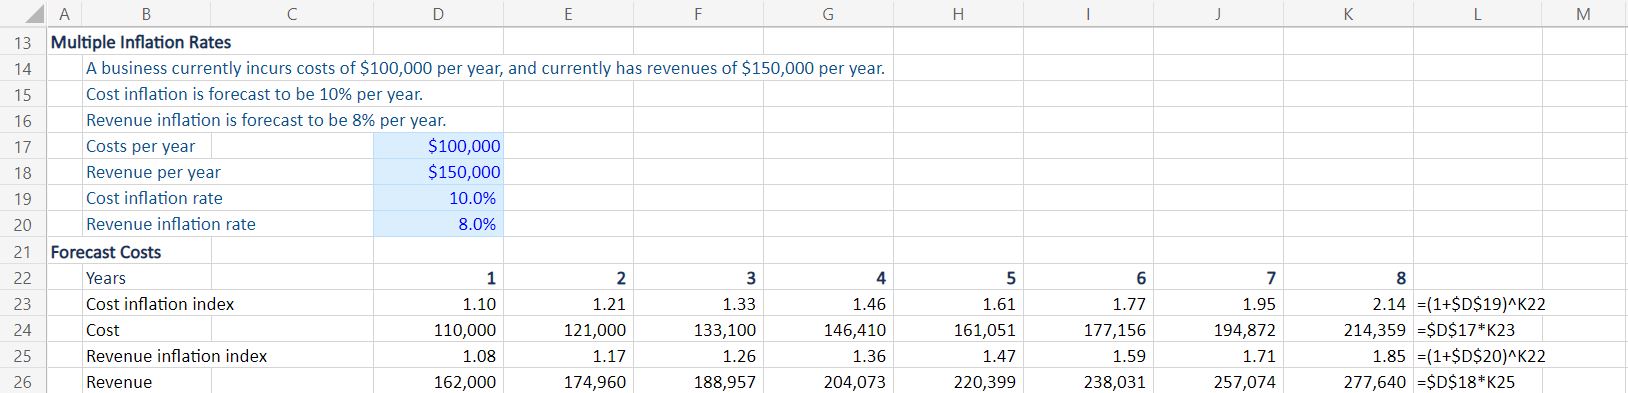
Can We Have More Than One Inflation Rate?
Yes, there is no reason for costs and prices to rise at the same rate. If different costs and revenues are inflating at different rates, we can have inputs for different rates and different inflation indexes. Look in the Excel example; it will look like this:
What Happens if the Inflation Rate Changes During the Model Periods?
You may start modelling during a period of high inflation, but you forecast that inflation will moderate in future periods; there will still be inflation, but at a lower rate. Or you may begin by modelling a period of low inflation and forecast that inflation will increase at some future date. Either way, it’s necessary to accommodate a change in the inflation rate.
You need to be careful at the point where the rate changes. Until that point the inflation rate, and the index will be based on the first rate in the normal way. However, after the rate change the index will be a combination of several years at the first rate followed by several years at the second rate. Remember that inflation will compound across the entire period.
We would need to clearly identify which periods are subject to the original inflation rate, and which are at the new rate.
One way of modelling the inflation index would be to use a formula as shown below:
IF (the first inflation rate period applies, (1 + initial inflation rate) ^ number of periods, else previous index x (1+ new inflation rate).
For example, the formula on line 39 below:
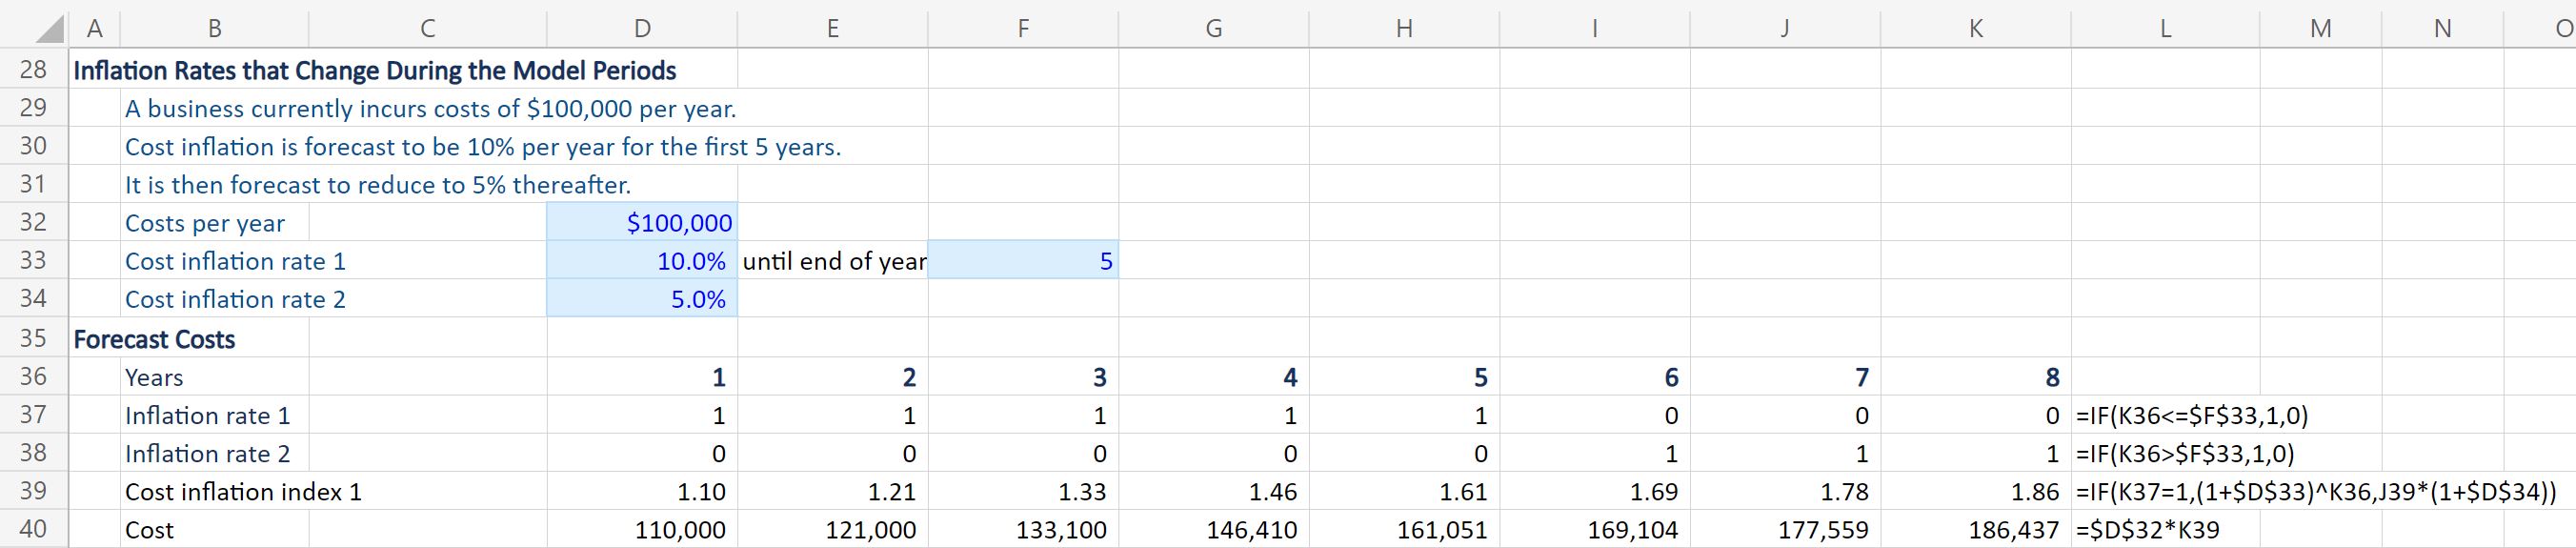
You can see that while inflation rate 1 applies (there is a “1” in line 37), the inflation index is calculated as (1+r) ^n in the normal way. When the inflation rate changes to rate 2, the IF statement identifies this from the “0” in line 37 and simply the previous period’s index, say the 1.61 in H39 by 1+r where r is rate 2.
Conclusion:
Inflation is a complex economic phenomenon, but it is usually quite simple to model. In most cases, we simply apply an exponential formula: (1 + rate) ^ number of periods.
With the Project Financier, learn the theory of project finance; risk management, financing methods, accounting, modeling and calculating returns. Then put that theory into practice and learn to build both simple and advanced project models.