
EV to Revenues
Send download link to:
Featured Product

EV / Revenues Multiple
November 17, 2020
What is EV / Revenues?
Enterprise value to revenues or EV / revenues is a valuation multiple used to value a company based on how similar companies trade. It is used in trading comparables analysis and uses the reported revenues of a company as the driver of its value.
It can be used for all companies but is particularly useful for companies with depressed earnings or companies that are loss making. This is helpful where it is not possible to calculate meaningful EV / EBIT or EV / EBIT multiples.
As with all valuation multiples, the value must be consistent with the value driver. Revenues is unaffected by a company’s capital structure and therefore is a driver of EV.
The multiple should only be used to compare similar businesses as different industries each have their own benchmark.
Key Learning Points
- EV / revenues is a multiple used to value comparable companies and focuses on revenue as the driver of value
- Revenue is unaffected by capital structure and is a driver of EV
- The multiple can be used for all companies but it very useful for companies with depressed earnings, loss market or fast-growing
- Revenues does not consider expenses; therefore operating efficiency is not factored into the multiple
- Revenues is a key driver of value and suggests the company has a large market capitalization
Calculating the Ratio
Calculate the PE, sales, EBIT and EBITDA multiples for Averiro Inc given the following information.
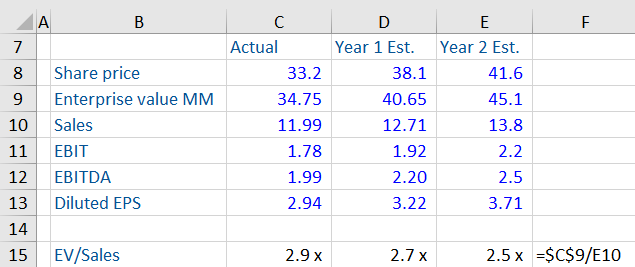
The first step is to calculate the Enterprise Value (EV). This the value of the core business before any financial assets and the deduction of debt. In other words, it is unaffected by a company’s capital structure. In this example, we have been provided with the value for all three years.
Next, we need to identify the revenues figure, and in this case, we have been provided with sales. The two terms are interchangeable.
The ratio is calculated by dividing the enterprise value by the sales figure for each year. The EV is always based on today’s value and you should never use forward figures. This is because we want to use the most up to date figures available.
On their own these ratios do not provide much meaning and need to be compared with industry benchmarks.
The sales figure is growing for each year. The implied growth rate can be calculated as:
Implied growth rate = (Current multiple / Forecast Multiple) – 1
This gives an implied sales growth rate of 5.9% and 8.4% respectively.
The ratio is decreasing over time. This is very common and is caused by using today’s value compared to forward value drivers. Growth in sales and earnings is commonly forecast causing the downward multiples trend.
Download our Excel sheet to see the workings for the remaining multiples.
Analyzing EV / Revenues
You will have noticed that EV/Sales purely considers revenue rather than EBIT; this means EV/Sales can be used to value unprofitable companies.
Companies with high growth and high returns attract a high valuation since returns depend on profitability and efficiency (see ROIC and Dupont disaggregation) companies with high sales per dollar of invested capital are more efficient, which contributes to a higher valuation.