
Forward PE Ratios Workout
Send download link to:
Featured Product

Forward P/E Ratio
April 16, 2021
What is the “Forward P/E Ratio”?
The forward P/E ratio is a version of the price to earnings (P/E) ratio that uses the expected future earnings of a company rather than the reported or historical earnings.
The basic price to earnings ratio shows the relationship between a company’s stock price and its earnings per share (EPS), usually for a 12-month period. The trailing P/E ratio relies on a company’s historic earnings performance, which has its limitations. A company’s past performance is not the only way to predict its future growth. For example, the company may have recently undergone an acquisition, where potential economic benefits are not reflected in the LTM P/E. The forward P/E helps address this limitation by using forecasted EPS.
The forward P/E indicates how much investors are prepared to pay today for the company’s future earnings. Investors can use it to compare two companies’ or industries’ expected performance and to decide which sectors are ‘over’ or ‘under’ priced versus the rest of the market.
Key Learning Points
- The forward P/E ratio shows the relationship of a company’s price (today) to its EPS forecasts
- The EPS figure used to calculate forward P/E ratio is an estimated number. A single company may have multiple forward P/E ratios based on different analysts’ varying earnings estimates
- Analysts can get EPS estimates from companies’ guidance forecasts or develop earnings estimates through independent research
- Forward P/Es can cover several time periods – such as a 1-year (or next 12 months) or 2-year (second 12 months) forward P/E
- When compared to the LTM P/E ratio, the forward P/E ratio serves as a better indicator of a company’s future growth potential – the LTM P/E ratio is based purely on historical earnings.
When comparing a peer group, a higher P/E ratio suggests a company (or sector or group) may be ‘more expensive’ to buy at today’s price than lower P/E ratio companies. Or it may show that investors are prepared to pay more for certain companies. In addition, if Company A is currently trading on a 1-year forward P/E of 12.1x and it usually trades on a 1-year forward of 16.3x, this may indicate that the stock is under-valued by the market at this particular point in time. Further investigation would be required.
Forward P/E Ratio Explained
The forward P/E ratio is calculated as:
= Current share price / Forecasted EPS
The current share price is readily available for any public company.
The forecasted EPS is calculated based on estimates using the information from sources such as company forecasts, industry reports, macroeconomic indicators, etc.
Example:
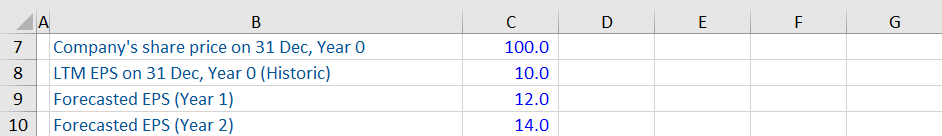
Based on the information below, we have been asked to calculate the LTM and forward P/E ratios for this company.
The LTM P/E ratio is calculated as follows:
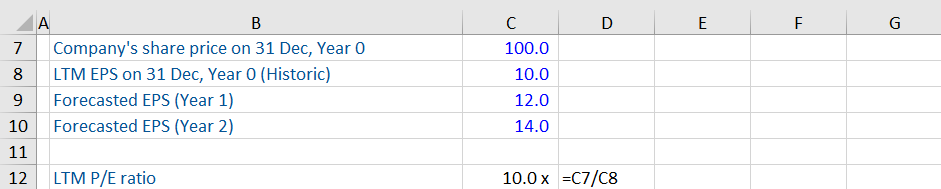
The LTM P/E is 10.0x suggesting that investors are prepared to pay 10x last year’s EPS to buy the stock. We calculate the forward P/E ratios using the one-year forward and two-year forward EPS as below:

The 1-year forward P/E is calculated at 8.3x. The two-year P/E is useful as it gives an additional data point to compare different companies’ or sectors’ future outlook. Typically, the longer time horizon, the lower the PE/ratio is likely to be. Investors will face more risk if buying future earnings 2 years away than for short-term earning potential.
It is important to note that forward P/E ratios should only be compared with relevant companies and sectors. Various markets, sectors and companies will offer different valuation trends so analysts must identify peers and market conditions carefully before making an investment decision. Investors may also be prepared to pay ‘higher’ P/E multiples at various points in the economic cycle if they see robust earnings or growth potential versus the rest of the market.
Example: Using the Forward P/E Ratio in Valuation
Below is a discounted cash flow (DCF) valuation with EPS forecasts. We have been asked to calculate the present value of terminal value using a 1-year forward multiple.

First, we will calculate the terminal value at the end of FY3 (assuming the steady state begins at FY4). We do so by multiplying the EPS at the start of FY4 with the 1-year forward PE multiple.

This gives us a terminal value of 110.3. Next, we can calculate the present value of this terminal value using Excel’s PV function.

This example shows the application of forward P/E ratio in DCF analysis. Apart from DCF analysis, forward P/E ratios are widely used by analysts and experts in the context of investment decisions & trends.
Here is an excerpt from a report published by Deloitte:

Deloitte Insights – The Growing Private Equity Market
This article focuses on the growth of the private equity market. It uses the forward P/E ratio of the S&P 500 index as an indicator of the equity valuations of all public companies. The article suggests that as the S&P 500’s forward P/E ratio has reached a decade-high level. This information may move investors away from public companies in the S&P 500 towards private equity.
The P/E ratio helps investors compare different stocks or sectors and guides their investment decision making process. If the forward P/E ratio of a company (in this case, it is a group of companies) has reached a 10-year high, it indicates these stocks may be expensive. At these levels, there is limited upside potential for investors. In such cases, analysts may advise investors to look at other asset classes, which may be relatively less expensive and may offer a higher potential of return.