
Fundamental Analysis Workout
Sign up to access your free download and get new article notifications, exclusive offers and more.
Featured Product

Fundamental Analysis
May 28, 2021
What is “Fundamental Analysis?”
Fundamental Analysis is a method of analyzing the intrinsic value of a security, asset, or business to see if it is fairly valued by the market. It is the estimate of the current value of future cash flows and includes assessment of factors (economic, industry, and company-specific) that could influence its price in the future. The underlying aim of fundamental analysis is to quantify the intrinsic value (i.e. correct price or true value) of a security/asset or business – which helps investors in making prudent investment related decisions.
This method of analysis values securities/assets or businesses based largely on the information contained in the financial statements of companies. While there are several methods for ascertaining the intrinsic value of a security or business, the two common models to establish the same are the Dividend Discount Model (DDM) and Discounted Cash Flow (DCF) model. The alternative to fundamental analysis is technical analysis which focuses on the historical performance of the share price (including volumes traded, price, and correlation to other events) to determine the value.
Key Learning Points
- Fundamental analysis uses economic data, company financial statements, and other publicly available datasets to analyze whether a stock is over or undervalued relative to its stock price
- The alternative is a technical analysis that focuses on historic share price movements relative to the market and other data points rather than fundamental data
- Fundamental analysis makes use of several ratios to determine the financial health of a company and the same are used to build a picture of how a stock is valued
- Fundamental analysis relies on creating estimates for sales, profitability, cash flows, earnings, and dividends which drives an estimate of the stock price, which can then be compared to the current market value
- This type of analysis can indicate whether a stock (or asset or business) is over or undervalued by the market
- The DDM is based on the dividends that are paid out by a company to its shareholders and can be used to determine if its stock is trading above or below its intrinsic value
- The DCF discounts a company’s/investments estimated future cash flows to estimate its true or intrinsic value
Dividend Discount Model and the Discounted Cash Flow Model
The Dividend Discount Model (DDM) calculates the intrinsic or true value of a firm, and thus its stock, based on the dividends that a company pays out to its shareholders. The formula for DDM is stated below:
V = D1/K-G
V = Intrinsic value of a stock
D1 = Dividend expected next year
K = Discount rate or the cost of equity capital
G = Dividends growth rate
Here the underlying assumption is that dividends are trending upwards at a stable growth rate (g) i.e., dividend is stable and predictable (as is typical of mature blue-chip companies) and grows at a constant rate. Further, in this model the current price is the intrinsic value of the stock (i.e., V). This model can be utilized to determine which securities are trading above or below their intrinsic value i.e., are they overvalued or undervalued (or fairly valued).
Using this formula, if a company’s dividend increases (decreases) in size, or the discount rate or cost of equity financing falls (rises) or the expectation for the future growth rate of dividends increases (drops), the intrinsic value of its stock will increase (decrease).
Next, the Discounted Cash Flow (DCF) is a valuation method that is used to quantify or estimate the true or intrinsic value of a company/investment by discounting its estimated future cash flows. In the stock market, the price of a stock, which is determined by the market, may be overvalued or undervalued i.e. may differ from its true or intrinsic value.
The DCF is a more complex model than DDM. This model can be used for a wide variety of companies that do not pay dividends or whose dividend patterns are not stable. Further, to use the DCF mode most effectively, a company should have positive, stable and predictable cash flows.
The formula for a Discounted Cash Flow (DCF) model is stated below:
DPV =∑ FV/(1+r)n
DPV = discounted present value of all future cash flows
FV = Future cash flow
r = Discount rate or real interest rate
N = Time in years until the future cash flow happens
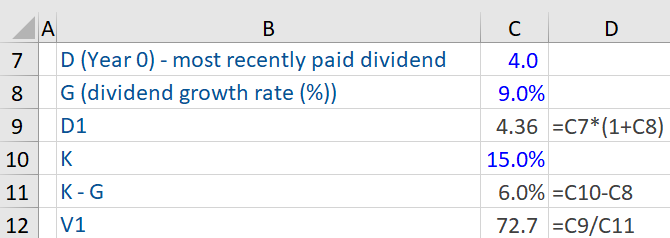
Dividend Discount Model – An Example
Given below is the computation of the intrinsic value of a stock, based on the Dividend Discount Model stated above. We assume that a company has just paid its annual dividend of $4 per share to its shareholders and its dividend growth rate is 9%. The dividend expected next year is $4.36. The discount rate or the cost of equity capital is 15%. Using the DDM formula, the intrinsic value of the stock is $72.7.
Fundamental Analysis – Key Ratios
Many investors use fundamental analysis to analyze a company and its stock price, and use key ratios to determine its financial health. The most important or popular tools of fundamental analysis focus on earnings of a company, its growth and value in the market.
Some very important fundamental analysis tools (ratios) that can help an analyst in beginning to construct a picture of how a stock is valued are earnings per share (EPS), P/E ratio, P/B ratio, dividend-payout ratio, dividend yield, return on equity, projected earnings growth and price-to-book ratio.