


Price Earnings-to-Growth (PEG) Ratio
May 19, 2021
What is the “PEG Ratio?”
The Price Earnings-to-growth or PEG ratio is used to measure the value of a company’s stock based on the growth potential of its earnings. This ratio is derived by taking a company’s Price/Earnings ratio and dividing it by the growth rate of its earnings over a specified period of time (usually, over the next 1-3 years), and is used to analyze the earnings potential of a stock.
A PEG ratio higher (lower) than 1 suggests that a stock is overvalued (undervalued) i.e. relatively expensive (cheap). A PEG ratio of 1 is supposed to indicate that a stock is fairly priced. Generally, a PEG ratio of less than 1 is desirable.
Key Learning Points
- The PEG ratio of a company is calculated by dividing the P/E ratio by EPS growth rate
- The PEG ratio is more suitable than the P/E ratio, when valuing high growth companies
- Trailing PEG ratio are calculated using historical EPS growth rates, while Forward PEG ratios are calculated using expected EPS growth rates.
PEG Ratio – Formula and Interpretation
The PEG ratio for a company can be calculated as:
PEG Ratio= Price/Earnings ratio/EPS growth rate
The P/E ratio measures the relationship between a company’s stock price and its earnings per share (EPS).
The EPS can be defined as a company’s net income divided by its total number of outstanding stocks and indicates the profitability of a company. A higher EPS growth rate is viewed more positively by investors.
Given below is an example:
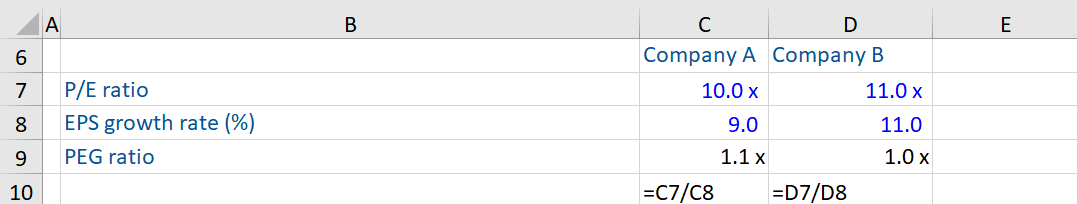
Company B’s P/E ratio of 11.0 indicates that investors are willing to pay 11 times per dollar of this company’s earnings. It is more than what they are willing to pay (10.0) for every dollar of earnings of Company A because its EPS growth rate is higher. Consequently, the lower PEG ratio of Company B validates the higher value placed by investors for its stock.
Role of PEG Ratio in Valuation vis-à-vis the P/E ratio
For a better expression of the valuation of growing companies, the PEG ratio, rather than the P/E ratio should be used. This is because while the P/E ratio is commonly used when valuing stocks, it does not take into account a company’s growth rate. On the other hand, the PEG ratio includes the P/E ratio and combines the same with the company’s expected earnings growth rate. Therefore, it expresses the valuation of such companies in a better way. The PEG ratio is more apt than the PE ratios when valuing high growth companies. This is because at higher rates of growth, the PEG ratios, in comparison to the P/E ratios, are less sensitive to changes in growth and stable too.
The P/E is affected by the growth rates of different companies. A company with high (low) earnings growth is likely to have a high (low) P/E multiple, making it appear overvalued (undervalued). The PEG ratio helps in cutting through the differences in P/E caused by different growth rates. Put simply, a company with a higher expected earnings rate is more valuable than a company with lower growth prospects.
The main drawback to the PEG ratio is you are looking at EPS growth over a very short period. So, a company expected to grow rapidly over the next two years could appear to have a very low PEG ratio indicating it is undervalued but analysts should question how likely this rapid growth is going to continue when using this metric.
Trailing and Forward PEG Methods and the EPS Growth Rate
In the trailing PEG method, a company’s earnings growth rate is calculated using its historical EPS growth rates. The growth rate can be for the past 12 months, 3 years, 5 years, or any other multiple year historical average On the other hand, forward PE ratios are calculated using expected EPS growth rates.
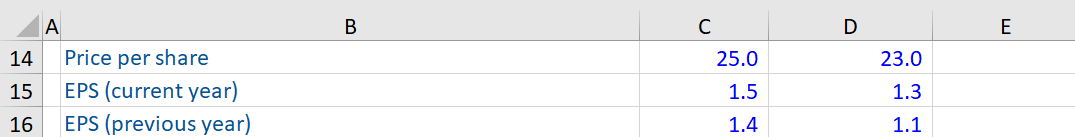
PEG Ratio – Based on Historical EPS Growth Rate
Given below is the calculation of the PEG ratio of Company A and B, based on their respective historical EPS growth rate:
The PEG ratio is calculated as follows:
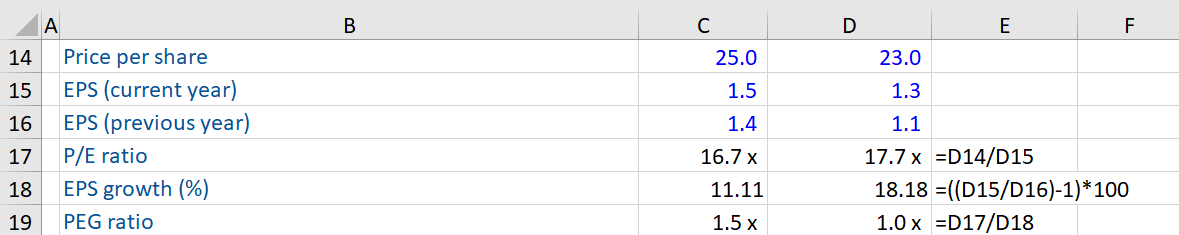
If we compare the two companies’ P/E ratios, investors place higher value on Company B’s stock (Its PEG ratio is lower than Company A’s). The higher growth in EPS witnessed by Company B justifies the premium investors are willing to pay for this stock.