Yield Curve
August 27, 2021
What is “Yield Curve?”
The Yield Curve, which is typically positive sloping, is the time-plot of nominal interest rates on government bonds of varying maturities – ranging from the very short-term to long-term (i.e. 30-year bonds). In other words, the yield curve shows the relationship between yields of government bonds and times-to-maturity. For example, there are US treasuries of different maturities – one month, 3-months, 1-year, 10-years, and 30-years. Suppose the yields on the same are 0.5%, 1.2%, 2.7%, 4%, and 5% respectively (i.e. there are different yields for treasuries of different maturities). If we plot these different maturities and yields on a graph, we get a yield curve (positive or upward sloping).
It might be noted that the yield curve represents the term-structure of benchmark rates for ‘risk-free’ government bond yields. Investors’ view of future inflation determines the level of the yield curve and the magnitude of the risk premium determines its slope. While long-term yields are affected by long-term growth prospects and inflation expectations, the short-term rates are driven by policies of the central bank (for example, the Federal Reserve in the US).
Key Learning Points
- There are three types of yield curves – positive sloping, inverted and flat
- Discount Yield and Investment Yield are two methods used to calculate yields on US Treasury bills
- To calculate the Treasury yield on US Treasury notes and bonds, information on the face value and purchase value of the same, coupon rate and time to maturity is required
Type of Yield Curves
There are three types of yield curves.
Positively sloping
The most common curve is the positively or upward sloping yield curve where longer-term government bonds have a higher yield than shorter-term government bonds. A yield curve is upward sloping if investors expect inflation and interest rates to be higher in the future. Further, given that the uncertainty regarding future inflation is higher for longer-term bonds, investors usually demand a higher risk premium for holding them.
Inverted or downward sloping
This is where shorter-term yields are higher than longer-term yields. Such a slope indicates that investors expect interest rates and consequently longer-term yields to be lower in the future than they currently are. Expectations of inflation and risk drop, which in turn result in driving down long-term yields. A downward sloping yield curve is often viewed as a harbinger of recession.
Flat
this kind of yield curve could be a result of either longer-term yields falling more than short-term rates or when short-term rates rise by more than the long-term yields. If a yield curve is flattening, this indicates the reduction of the yield spread between longer-term and shorter-term government bonds. The reason for a flattening yield curve could either be that investors expect lower inflation or the central bank to increase its policy rate (for example, the federal funds rate in the US) in the near future.
Example: Yield – US Treasury Bills, Notes and Bonds
There are two methods, known as Discount Yield and Investment Yield, which are used by the US Treasury Department to calculate the yields on US Treasury bills that mature within a year.
In the first method (discount yield method), the Treasury yield is calculated as a percentage (%) of the face value of a US Treasury Bill (for example, a 90-day bill). For example, if an investor purchases a 90-day treasury bill at less than the face value (US$ 6,000) i.e. for US$ 5,900 (in other words, purchases this bill at a discount to par value) and redeems it at maturity for face value, the discount yield is calculated by the following formula:
Discount Yield = (Face value – Purchase Value)/Face Value)* (360/91) = 6.59%
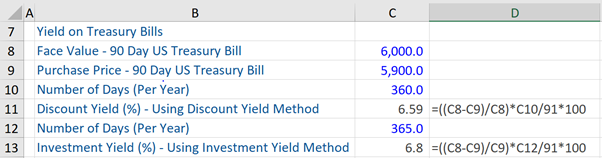
In the second method (investment yield method), the treasury yield is computed (above) as a percentage of the purchase price of a US Treasury Bill (for example, a 90-day bill). The formula for the same is:
Investment Yield = (Face value – Purchase Value)/Purchase Value)* (365/91) = 6.8%
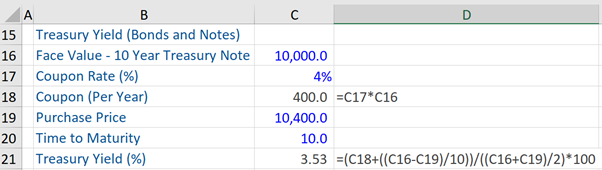
Next, for calculating the treasury yield on treasury notes and bonds held until maturity, which includes coupon payments on the same (semi-annually) and the face value of the bond that is repaid to the investor at maturity, the formula is:
Treasury Yield = (C + (FV – PP)/T)) / (FV + PP/2) = 3.53% (refer to the example below)
C= Coupon rate
FV = Face value
PP – Purchase Value or Price
T = Years or Time to Maturity