


Benchmarks
April 23, 2021
What are “Benchmarks”?
Benchmarks are reference points used to compare a company’s financial metrics against previous performance, other companies or competitors, and its forecasts or budgets pertaining to new projects. In finance, benchmarks have widespread application, including valuation (both intrinsic and relative), company performance, and project finance.
Key Learning Points
- Broadly, there are three ways to use benchmarks: benchmarking forecast estimates of key financial data; benchmarking operational and valuation metrics against comparable companies; and benchmarking financial estimates of new projects against budgets of similar projects in the past.
- Benchmarking is a way to establish a company’s relative position and performance in an industry.
- When calculating growth rates, beware of years where there is M&A activity that will manipulate the sales number.
- The benchmarking analysis precedes the trading comparable multiple analysis and allows for a more targeted selection of trading comparables.
Benchmarks Explained
Previous Performance
In this type of benchmarking, a company may want to benchmark its forecast estimates of growth, profitability, liquidity, turnover and leverage etc. to previous or historical performance.
For example, a company forecasts (5 years ahead, Year 1 to 5) key financial data (such as revenue growth, cost as % of revenues, margins, operating working capital as % of revenues etc.) – using financial models – by making assumptions based on historical data. Thereafter, these forecast estimates are benchmarked against the historical data. The historic data then serves as a benchmark for checking the reasonableness of the forecasts.
Comparable Companies
In the trading comparables method of valuation, similar businesses are used for establishing the valuation range of a corporation. Key metrics, including operational metrics, such as sales growth and EBIT margin, and valuation metrics, such as equity and enterprise value, are calculated for comparable companies. These values are then used as a benchmark to extrapolate the value of a business and make comparisons.
Forecasts or Budgets
In project finance, analysts make various estimates about the projected revenues and costs of a new project. These estimates are benchmarked against the budgets of similar projects completed in the past. Benchmarking helps in checking the reasonableness of the assumptions in the model.
Example 1: Using Previous Performance as Benchmark Reference
Given below are actual figures and forward estimates for a company. We use historical performance as a benchmark to check the reasonableness of the forecasts. Year -1 A and year 0 A represent actual figures and the remaining (Years 1 E to 5 E) are estimates or forward assumptions.

Revenue Growth
By using the benchmark, we can discern that there is a drop in revenue growth over time.
Cost% of Revenues
The estimates of cost as a percentage of revenues are in line with historical performance (i.e., the benchmark)
Margins
There is a jump in margins in Year 0 from the previous year.
OWC% of Revenues
Operating working capital as a percentage of revenues is dropping in the estimates when compared to historical performance.
Tax rate
The tax rate estimates are lower than actual performance. A lower tax rate implies an increase in cash flows.
Example 2: Comparable Companies Benchmarking
Given below is information pertaining to 5 companies operating in the same space.
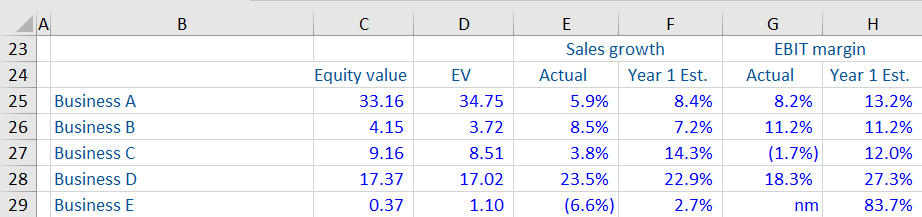
Business E
It seems as if this company has come out of restructuring, with a very low enterprise value (EV), accompanied by negative sales growth and non-meaningful EBIT margin in the actual year. This is followed by an extremely high forecast EBIT margin for Year 1. This company is probably not comparable to the rest of the companies.
Business D
This seems to be a high-growth company, with sales growth over 20.0% for 2 years in a row and relatively high margins compared to companies A to C. It is probably not comparable to the rest of the companies.
Business A
This company has sales growth in line with peers, but EBIT margin seems to grow fast from actual year to Year 1. If this were a retailer, an increase like this would be unusual. It is also much larger in size, from looking at EV, although the size difference does not necessarily make it non-comparable. On balance, Business A may be comparable to business B.
Business C
This company has a negative EBIT margin in the actual year, followed by a high EBIT margin in Year 1. It also has low sales growth in the actual year, followed by very high sales growth in the following year.