
Income Statement Analysis Workout
Sign up to access your free download and get new article notifications, exclusive offers and more.
Featured Product


Income Statement Analysis
October 27, 2020
What is “Income Statement Analysis”?
The income statement presents all the income and expenses a company incurs over a period of time. We use various ratios to assess the company’s performance over time and make forecasts/predictions. The most common ratios are:
- Sales growth
- Gross profit / sales (“Gross margin”)
- Operating profit / sales (“Operating margin”)
- Net income / sales (“Net margin”)
- EBIT / sales (“EBIT margin”)
- EBITDA / sales (“EBITDA margin”)
On their own, these ratios will not offer more than just a number. Instead, they can be used as comparable metrics by comparing a company’s profitability from one year to the next or with a competitor for the same period.
Key Learning Points
- The income statement reports the changes between the retained earnings ending balance between two accounting periods
- The statement presents all the income and expenses a company incurs over a period of time
- There are many financial metrics which can be used to help understand the operational performance and profitability of the business
- EBIT represents the profit generated from a company’s operations after excluding non-recurring items
- Financial ratios are useful but should rarely be analyzed on their own. Instead, they provide a much better indication of a company’s performance when compared to historic data or other companies operating in similar industries
Coca-Cola vs PepsiCo
To demonstrate these ratios, let’s look at the comparison between two similar companies. We will use Coca-Cola vs Pepsi for the year-ended 2017:
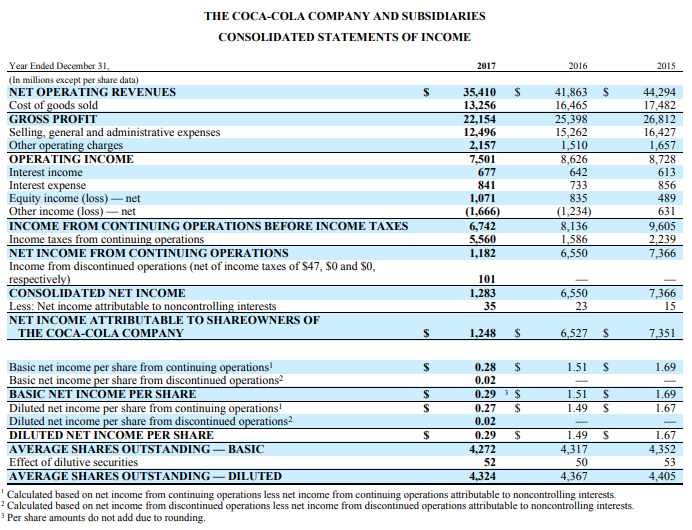
The Coca Cola Company – Income Statement 2017 Extract

PepsiCo Inc – Income Statement 2017 Extract
The first step is to review the income statements and identify the items needed for the margin calculations. All figures reported in the table are in $ millions.
Operating Margin
Operating margin is a profitability ratio and measures how much profit a company makes per one dollar of sales. We need to identify two items for this calculation, the reported revenue and operating profit for the year ended 2017. For Coca-Cola, this is presented as the operating income but means the same figure. The data is reported below:

Net Income Margin
The operating margin is calculated by dividing the reported operating profit by the sales for that period. The results show that for every 100 dollars of profit made, $21 dollars is contributing towards Coca-Cola’s operating profit and $17 dollars towards Pepsi’s. This shows that Coca-Cola are managing their costs more efficiently to generate a profit. Pepsi who operate in a similar industry will want to review their pricing strategy and direct materials costs.
Net income is the total profit available after all expenses have been deducted for the period. The net income margin shows the percentage of revenue left after all expenses have been deducted. This is another profitability ratio which measures the amount of net income generated in relation to a company’s sales.

EBIT Margin
Earnings before interest or tax (EBIT) is a calculated figure which shows the profitability of a company from its operations after excluding non-recurring items. Excluding these items can improve comparisons with competitors as well as providing a useful starting point for predicting future profitability.
For many companies, this figure may be the same as operating profit and it’s up to the analyst to decide which items need adjusting to generate a “clean EBIT” figure. The calculation starts with operating profit and adjustments are made for any deemed non-recurring items.
For Coca-Cola, there is a line item in their income statement called “other operating charges”. It is not clear what this item includes and is a good place to start.
The MD&A or footnotes usually provide us with more information on these items. Below is an extract from Coca-Cola’s 8-K report, which highlights non-recurring items identified by management including the amounts involved in other operating charges.

Extract from Coca-Cola’s Reported (GAAP) Fourth Quarter and Full-Year 2017 Results
For PepsiCo, the income statement itself doesn’t highlight any non-recurring items. However, the MD&A does provide some detail on these, as shown in PepsiCo’s 8-K extract below.

Extract from PepsiCo Inc Reported (GAAP) Fourth Quarter and Full-Year 2017 Results
We now need to decide which items above we view as non-recurring. We then add them back to the operating profit line for a “clean EBIT” figure.
The table below includes the reported operating profit with a list of all the non-recurring items that can be added back to the earnings figure. The adjusted operating profit figure shows a large increase for Coca-Cola in comparison to the operating profit margin (21% to 27%). This shows the profitability generated from operations is much greater when excluding non-recurring items, as the company is undergoing a large restructuring program.
PepsiCo only had one item added back to their operating profit figure. Due to their high sales figure for the period, this made little difference to the margin (remains at 17%).

EBITDA Margin
Earnings before interest, tax, interest, depreciation and amortization is calculated by taking our EBIT number and adding back the expenses relating to long lived assets. Companies may have different depreciation and amortization policies for these assets, resulting in a larger (or smaller) expense. This will in turn reduce (or increase) their EBIT. Adding back these expenses can make it easier to compare with competitors.
The EBIT figure has already been calculated, so the depreciation and amortization expense (“D&A”) needs to be identified from the statements and added back. The figures can be found in the statement of cash flows under operating activities.

Extract from Coca-Cola Statement of Cash Flow 2017

Extract from PepsiCo Statement of Cash Flow 2017
The table below shows the EBITDA figure calculation using our EBIT figure from above and the reported D&A figure. The margin can be calculated by dividing EBITDA by the sales for the same period.
We notice that Coca-Cola has an EBITDA margin of 31%, which is higher than the PepsiCo’s EBITDA margin of 21%.
