
Featured Product


Profit
November 12, 2020
What is Profit?
Profit is the earnings a company generates after deducting its expenses from its revenues. Profit is reported in the income statement, which provides further detail on the income and expenses a business incurs over a period of time. The income statement reports many different profit figures, and it is important to understand what each of these line items represents.
Key Learning Points
- Profit is the earnings a company generates after deducting its expenses from its revenues for the same period
- There are many different profit figures presented in the income statement
- Profits are reported in the income statement which is based on the matching principle i.e. revenues are matched with the expenses associated with those revenues
- Profitability margins express profits as a percentage of sales and should be compared to industry benchmarks for reasonable analysis
Common Reported Profit Items
Below show the most common line items:
Gross Profit
Gross profit is the profit a business makes from revenue generated by selling a product or a service and deducting the cost of goods sold or operating expenses.
When calculating the gross profit, it’s important to understand the difference between variable and fixed costs. Variable costs change based on the number of products or services produced. In other words, these are costs directly attributable to producing a product or a service. Examples of variable costs are direct labor, materials, depreciation and production.
Operating Profit
Operating profit indicates the profits a company earns from its core business function before interest and taxes. Operating profit also excludes incomes generated from investments. It enables analysts to measure a firm’s efficiency to manage its costs and to ensure the effective running of its operations.
Pre-tax Profit
Otherwise known as Earnings Before Taxes, pre-tax profit indicates the profit a company has earned before taxes. To calculate pre-tax profit, a company deducts cost of goods sold, operating and interest expenses from the revenue.
Key ratios
- Gross margin – shows the profits of production, which is driven by both price advantages and cost advantages. It measures how effectively a company turns its revenue into gross profit. The calculate the ratio, divide gross profit by the revenue. It’s expressed as a percentage.
- Operating margin – a profitability ratio that measures how much profit a company makes per one dollar of sales. It is calculated by dividing the reported operating profit by the sales for that period. Alternatively, start with reported revenue and subtract cost of goods sold, SG&A and other overhead costs. Divide the operating income total by reported revenue and multiply it by 100 to express as a percentage.
- Pre-tax profit margin – measures the operating efficiency of a business and indicates the percentage of sales that has transferred to profit.
Examples
Gross Profit
Extract from Accenture Consolidated Income Statements for the Year Ended August 31, 2019.
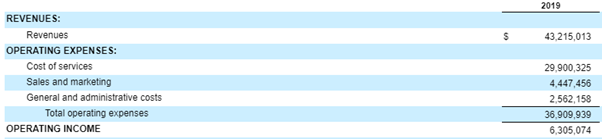
Analysis
- Accenture’s gross profit margin is 14.6% (6,305/43,215) x 100
- Accenture provides a service, so the company reports operating expenses, not cost of goods sold like manufacturing companies
- Accenture contracts consultants who provide a service to generate revenue, so the company reports those costs under ‘Cost of services’
- Accenture’s consultants incur marketing and administrative costs in order to provide a service, which is reported under ‘Sales and marketing’, and ‘General and administrative costs’