Save 40% on all online finance courses
Information Coefficient (IC)
October 21, 2025
What is Information Coefficient (IC)?
The Information Coefficient (IC) is a quantitative tool that investors use to determine whether an investment signal effectively predicts the return of an asset. It essentially measures the correlation between the model’s predicted returns and the actual return of an asset over a given period. A positive IC indicates that the forecasts are directionally consistent with subsequent performance, while a negative IC suggests the signal is systematically misleading. A reading close to zero suggests that the signal does not add reasonable value beyond noise.
IC is a solid tool for assessing the predictive strength and robustness of quantitative alpha models, factor exposures, and portfolio construction processes. It offers a clear measure of forecasting skill (this can also be applied to portfolio managers’ decisions) and is independent of the magnitude of forecasts, but only dependent on their rank ordering relative to actual outcomes. Investors usually assess a signal’s robustness across various time periods, regions, and industries to ascertain whether it has true economic significance. Results can compound into significant excess returns if they are continuously positive, even at modest levels.
Key Learning Points
- The Information Coefficient quantifies the relationship between predicted outcomes and actual results, and it is primarily used to evaluate the accuracy of investment signals
- IC values range from -1 to 1. Positive values show that predictions align with actual returns, while negative values suggest an inverse relationship. Values close to zero indicate no predictive power
- The measure is commonly used in quantitative investing to evaluate factor models, alpha signals, and stock selection strategies
- A key limitation of the IC is that it can be unstable over shorter time periods. It can be influenced by noise or changes in market conditions
Explaining the Information Coefficient
The Information Coefficient (IC) is a key concept in quantitative investing. At its core, it shows how strongly and consistently forecasts (whether based on models, investment factors or discretionary signals) relate to actual outcomes.
Its focus on directional accuracy rather than absolute prediction size makes it popular across various investor types. For a signal to be useful, it just needs to rank securities according to predicted performance, it does not need to predict the precise level of future returns. When used consistently across a wide range of securities, even a slightly favourable result can eventually become a primary source of alpha. On the other hand, a consistently negative result can indicate that a factor is contrarian in nature, which in fact could still be applicable to some strategies.
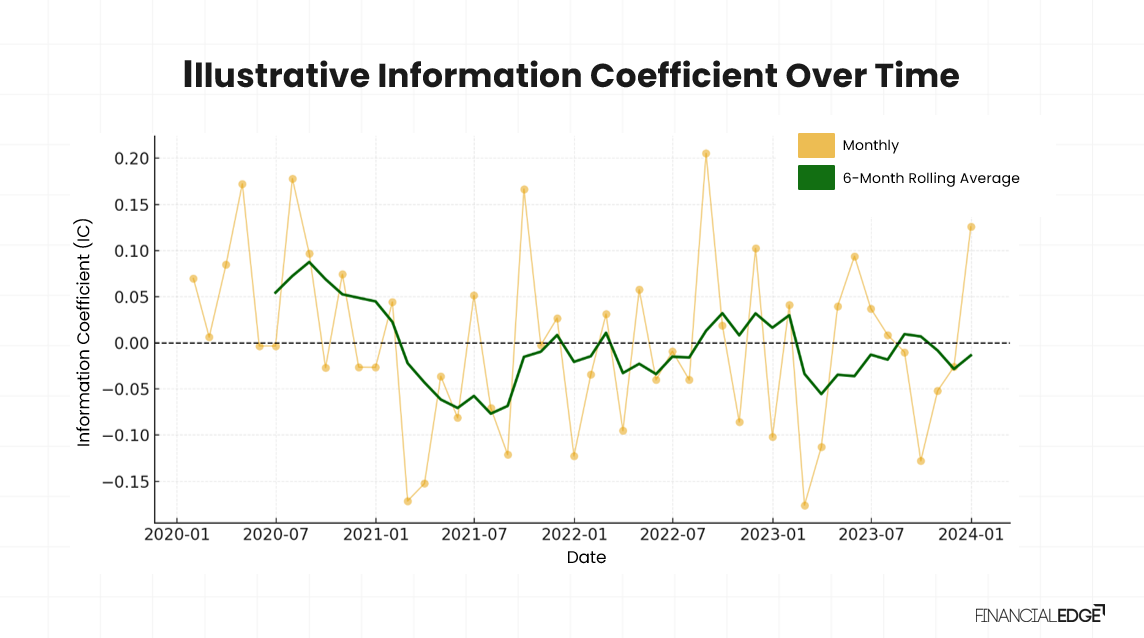
The chart below is an illustrative example that includes time series of IC values measured monthly over several years. The correlation between the actual returns realized during that period and the expected returns from a model (or factor) is represented by each point. The green line represents the 6-month rolling average – it smooths out the fluctuations and makes it easier to see the underlying trend in predictive power.
What we can conclude from this chart:
- Variations around zero – the IC shows that predictive power is not constant by fluctuating above and below the zero line
- Despite the negative readings, the values tend to cluster slightly above zero – this suggests that the signal has a modest but consistent edge
- The monthly volatility highlights the influence of the prevailing market conditions. No investment signal can outperform uniformly in all environments
- Since perfectly smooth or always-positive ICs are not possible, investors would focus on:
- The average reading – whether it is positive
- The distribution of values – do they demonstrate robustness or randomness
In practice, charts like this help investors judge whether a signal is genuinely predictive, regime-dependent, or likely a product of overfitting. They also help investors assess the quality of a signal.
How is IC Calculated?
The Information Coefficient (IC) is typically calculated as the cross-sectional correlation that measures the linear relationship between two random variables – the forecasted and the actual returns on an investment. The formula is:
Where:
t = the specific time period
Corr = the correlation between the two variables
FRit = the forecasted return on the investment during the period t
Rit = the realized return on the investment during the period t
How to interpret the results?
The Information Coefficient ranges between -1 and +1.
- +1 indicates perfect prediction (i.e. assets were ranked exactly as they performed)
- 0 means that the signal has no predictive power
- -1 shows a perfectly wrong prediction (i.e. the signal is systematically inverted)
The IC is typically calculated for each period (daily, weekly, or monthly) and then analyzed over time to assess its stability and statistical significance.
Example of the Information Coefficient
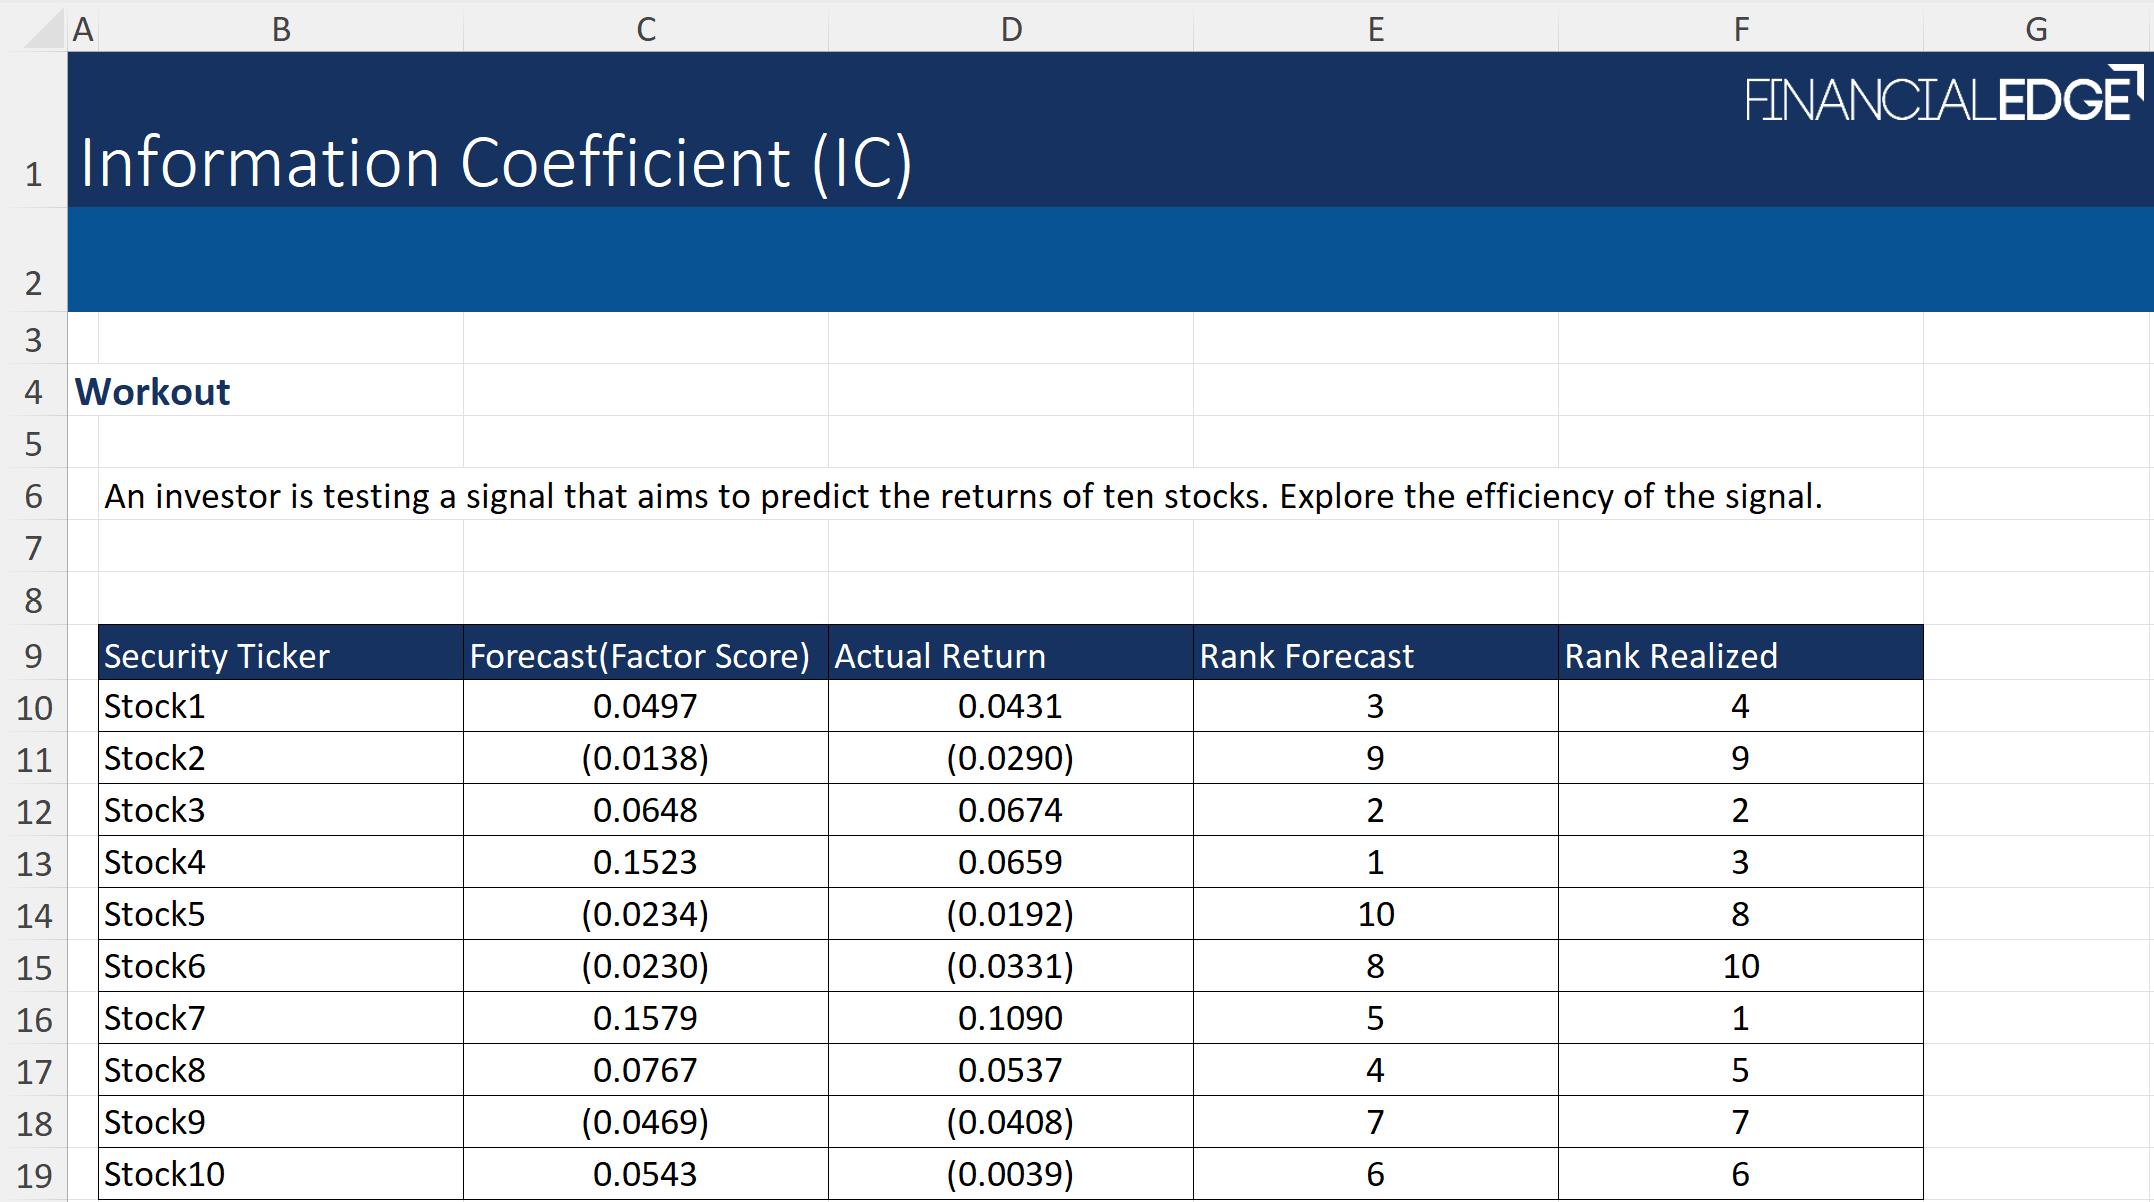
Below is a practical example of how the IC is calculated and how to read the results.
To calculate the Information Coefficient, we will use:
- Pearson Information Coefficient, which measures the linear correlation between predicted and realized returns
- Spearman Information Coefficient, which measures the rank-order correlation between predicted and realized returns
How to Interpret the Results?
- Both ICs are extremely high. The signal demonstrates exceptional predictive skill both in level accuracy and relative ranking
- A Pearson IC of 0.92 means that the forecasts and realized returns are almost perfectly linearly related
- A Spearman IC of 0.82 still indicates an excellent directional relationship, but it’s lower because the rank order isn’t perfectly preserved
- In practice this is extremely rare and would imply a highly effective forecasting or factor model — far stronger than typical empirical ICs that typically range between 0.02 and 0.10
Notes: When Pearson is higher than Spearman, the relationship is highly linear, but not strictly monotonic (small local inversions in ranking). Proportionally accurate forecast magnitudes also support higher Pearson even if ranks shuffle slightly. In addition, outliers or tightly clustered forecasts can amplify linear correlation without improving rank correlation.
What is Considered a Good Information Coefficient?
A good Investment Coefficient value in reality is much smaller than what many investors would expect. Since even modest positive values can be highly meaningful, a reading of 0.05 and 0.1 is generally recognised as strong. Values above 0.15 are exceptionally rare and usually raise questions about whether the signal is overfitted. The significance of an IC lies not in its absolute size but in its persistence and stability. This is due to the compounding effect that a small positive value can generate meaningful excess returns over the long-term.
The below table summarizes what IC values would typically indicate.
| Value Range | Interpretation | Typical Use Case | Reliability | Further Actions |
| > +0.15 | The signal has extremely strong predictive power | This is very rare in practice and usually signals overfitting | Potentially not sustainable across regimes | Investors would typically scrutinize the robustness of the signal before using it |
| +0.05 to +0.15 | Strong, consistent alpha signal | This is the most common target for quant factors | It can be robust if persistent across various time frames and sectors | It is highly valuable for systematic-based investment strategies |
| 0 to +0.05 | Relatively weak signal, which however could be exploited | Typically applied in broader universes where signal-to-noise is low | Gains often compound with diversification | It is worth integrating it alongside other factors |
| ≈ 0 | No predictive power | Random noise | Not statistically significant | Discard or re-test model |
| < 0 | Negative predictive power | Contrarian factor, inverted strategies | It can be useful if consistent and explainable | Investors may consider flipping the signal |
Limitations of the Information Coefficient
While the Information Coefficient (IC) is a useful tool for evaluating the predictive power of investment signals, it also has several notable limitations. These include:
- Since it is a statistical measure, the IC is subject to sampling errors. Values can be unstable over short samples or small universes, leading to misleading conclusions
- It has a linear focus – IC captures only linear (or rank-order) relationships between forecasts and realized returns (missing non-linear or conditional effects). While Spearman rank IC addresses directional ranking, it still reduces a complex relationship into a single summary statistic
- IC is context sensitive – it can fluctuate across different market environments, which limits generalization. Without aligning the IC calculation to the intended holding period, conclusions may be misleading
- There could be an implementation gap as IC does not consider transaction and/or operational costs, liquidity and capacity limits
Conclusion
To sum up, the Information Coefficient is a useful tool for assessing the efficiency of an investment signal by exploring the relationship between forecasts and actual returns. Despite investors often using it in a couple of areas such as investment idea generation and portfolio construction, it is still a statistical measure and therefore sensitive to noise and market shifts. It is most accurate when assessed over longer periods and alongside complementary metrics.


