
Creating Interactive Visuals Guide
Sign up to access your free download and get new article notifications, exclusive offers and more.
Recommended Course

What is Data Cleaning?
September 14, 2022
What is Data Cleaning?
Data Cleaning (also referred to as Data Cleansing) is the process of preparing a dataset so it is suitable for analysis and visualization. Data is messy. A typical dataset will contain typing errors, spelling mistakes, missing data, or even formula which has produced errors. All of these issues need to be identified and resolved before the data is used for analysis. Programs such as Excel and Power BI have a wide range of tools to help clean data efficiently.
Key Learning Points
- Cleaning Data is the process of identifying and fixing any errors such as spelling mistakes, typing errors, or missing data that could affect the results of your analysis
- It is important to take time to explore the data and identify where these errors occur by using tools such as Filtering or Profiling
- Use Replace Values to keep the values in a column consistent or to remove unwanted characters
- Use Split columns to separate a text string into multiple columns. A common method is by using a delimiter such as a comma, which can be used to determine where the text string is split
- Always check for duplicate rows of data and remove them before analysis to ensure your totals and calculations are accurate
How do you Clean Data?
The first step in cleaning data is to explore the dataset to identify what issues exist. There are several ways in which you can do this, depending on what software you are using.
Filtering
Most programs such as Excel or Power BI will have a filter. This will help you identify what values are being used in each column and to see if there are any typing or spelling mistakes, errors, or blanks which need to be fixed.
The filter in the example below will show that “USA” and “United States of America” both exist in the Country column. It is really important to have consistent spelling in any columns you are using for analysis. So, you don’t end up with the problem we see in the chart below, where two separate totals are used for one country:
Column Profiling
Power BI Query Editor has a really useful tool called Column Profiling. This allows you to check what percentage of a column contains errors or blanks. One or two errors/blanks in a column containing 1000’s of values is not a big problem. But if you discover that 75% of the column contained blanks, you might decide not to use it in your analysis or perhaps see if you can locate the missing data elsewhere. The View Tab in Query Editor will turn on Column Quality so you can see how many VALID values, ERRORS, and BLANKS (EMPTY) exist in a column.


Data Cleaning Examples
Some of the most common tools used to clean data are:
1. Replace Values
This is a really useful way to correct typing or spelling mistakes to help make the data values consistent. So for example, you can use Replace Values to change all occurrences of “USA” to “The United States of America”

You can also use Replace values to remove unwanted characters. So in this example, the values all contain the same text string “USD” at the end. This would prevent any calculations from being done on the data. You could use Replace Values to replace “USD” with nothing and then convert the column to a numeric data type:

2 Split Columns
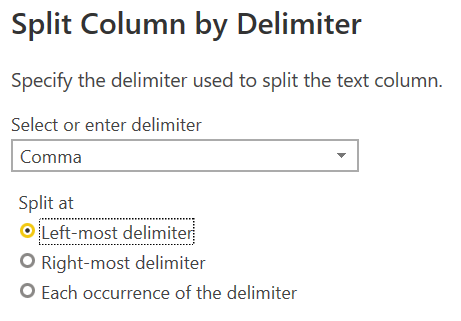
Sometimes a single column will contain a text string that should really be held in separate columns. In the example below, you will need to split the column in order to find the total sales by country or average sales per product,
There are different ways to split a column. One of the most common is with a delimiter. This means you can identify a character such as a comma to tell the program where to split the text in each row:


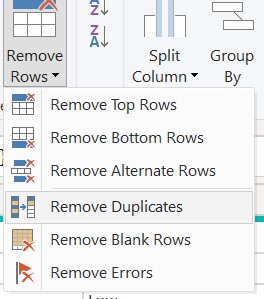
3 Remove Duplicates
It is always important to check if there are duplicate rows of data and then removes them from the dataset. If you don’t, your totals will not be correct as you will be including the same values more than once. Most programs like Excel and Power BI have an option to Remove Duplicates
Does Data Cleaning Matter?
So, having looked at what Data Cleaning is, the answer to this question is undoubtedly Yes! Most datasets will require some degree of cleaning. It is really important that you spend time identifying where the data is “dirty” and use the tools at your disposal to change it to “clean” data. Taking the time to do this properly will ensure that you are able to accurately analyze the data and produce meaningful and insightful visuals for your audience
Explore data cleaning, visualizing data, and producing effective dashboards with our online Data Visualization and Power BI course, developed in partnership with Neueda.
Additional Resources
Bar and Column Charts in Power BI
Interactive Data Visualization
Power BI Conditional Formatting