
Volatility Workout
Send download link to:
Recommended Course

Volatility
August 26, 2021
What is “Volatility?”
Investments are valued on several factors, including risk and return, which are the dominant drivers of investment decisions. Portfolio (or individual assets) investments are all about balancing the risk and reward within the same. Given a level of acceptable risk, an investor should seek out the highest level of return.
The term volatility is the most popular way of expressing, understanding, and quantifying the risk of investments and portfolios. So risk, and therefore volatility is an indication of how variable outcomes are. The Modern Portfolio Theory (MPT) incorporates volatility into its analysis. Greater the risk/volatility of a portfolio or investments, the higher is the required return by investors.
Key Learning Points
- Standard deviation is a widely used measure to gauge the volatility of individual assets or a portfolio.
- When we refer to the volatility of portfolios, we also need to take into account the correlation between each asset class.
Measuring Portfolio Risk or Volatility
Volatility or risk can be defined by the varying degree of prices over a period of time i.e. how widely do the outcomes vary. Two measures, standard deviation, and variance measure the volatility of outcomes. Here we focus on standard deviation.
The standard deviation of a portfolio helps to determine the riskiness of an investment, relative to the expected rate of return. A portfolio that has a high (low) standard deviation, implies that the portfolio risk is high (low), and the return is more (less) volatile i.e. the returns of a portfolio are more (less) stable.
To compute the standard deviation of a portfolio, three categories of data are required i.e. the standard deviation of every asset that is included in the portfolio, the respective weights of each asset in the portfolio (in other words, the proportion of each asset in the total portfolio) and the strength of correlation between each pair of assets (for ex. correlation between stock 1 and stock 2, stock 1 and 3, and stock 2 and 3).
Regarding standard deviation of a portfolio, also known as volatility, given below is the formula for a portfolio of two assets (for example, two stocks, i.e. stock 1 and stock 2)
Standard Deviation (σρ) = SQRT (σ1^2 w1^2 + σ2^2 w2^2 + 2w1w2*Corr (1.2) σ1 σ2)
Note: Standard Deviation (σρ) = Square root of Variance (i.e. square root of σ^2)
Here we take the variance of each asset and multiply it by each of their weightings (i.e. proportion in the overall portfolio) squared and include how both these assets correlate with each other in this equation (refer to the example below). Therefore, the risk of a portfolio is not just made up of the risk of individual assets, it also takes into account the interactions of the assets together – which we measure with the statistic called correlation.
It is easy to interpret standard deviation across assets or portfolios. We can calculate standard deviations for single assets and for broad portfolios with multiple assets too.
Since we are talking about portfolios, rather than individual assets here, we also need to get a sense of how the assets included in the portfolio move together i.e. how does each asset class in the portfolio correlates with the other. Here we come up with concepts of correlation and covariance. These measures quantify how assets move together or in the opposite direction, or don’t move together at all.
The correlation coefficient gives us an idea of whether two assets (stocks etc.) are positively, zero, or negatively related. Unlike covariance, correlation tells us about the degree or strength of the positive or negative relationship (i.e. correlation between assets can range between -1 and +1).
Corr (X, Y) = Covariance (C, Y)/ σX * σY
If both assets have a correlation between -1 and +1, which is what happens in practice 99% of the time, the standard deviation (volatility) of the portfolio is actually going to be less than the weighted average of the individual security standard deviation and that is because of diversification.
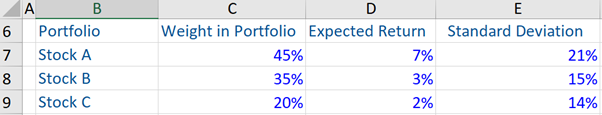
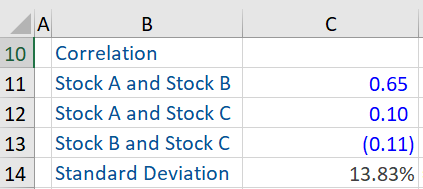
Volatility – Standard Deviation of a Portfolio
Given below is an example of a portfolio that comprises of three stocks, stock A, stock B, and stock C. The standard deviation of the overall portfolio has been computed. From the information given below, we can see that while the standard deviation of stocks A, B and C in the portfolio are 21%, 15% and 14% respectively, the standard deviation of the portfolio is 13.83%. This is a result of the correlation (+ or -) between these stocks.
Learn more about portfolio management with our Portfolio Management Certification.
Additional Resources