Five Key Ratios Investors Should Know
July 23, 2021
What are the “five key ratios investors should know?”
Investor ratios are primarily concerned with establishing individual per share statistics of profits, dividends, assets and cash flows for the equity shareholders, and relating these measures of performance to the market price of equity shares. Among the most important investor ratios that investors should be aware of are: earnings per share, price-earnings ratio, dividend yield, dividend cover and cash-flow per share.
Ideally, investor ratios should be based on forecast earnings, dividends, asset values and cash flows, since these figures are often related to current market prices of shares, which are anticipating future earnings, dividends, assets and cash flows. It is logical to use forecast figures.
Key Learning Points
- Ideally, investor ratios should be predicated on forecasts, rather than historical figures;
- Among the five most important ratios are earnings per share, price-earnings ratio, dividend yield, dividend cover and cash-flow per share; and
- As a measure of investment performance of a company, earnings can sometimes be problematic. Therefore, cash-flows are increasingly being used to measure such performance.
Five Investor Ratios – Definitions and Formulas
The following five investor ratios are among the most commonly used by equity investors and analysts:
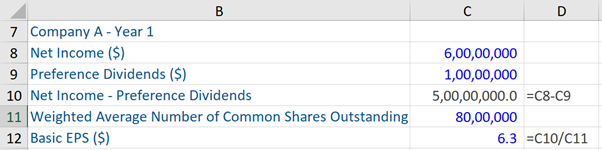
Earnings per share: this is defined as the ratio of net income to the weighted average shares outstanding of a company. This ratio generally indicates the profitability of a company.
Earnings Per Share (EPS) = Earnings/Weighted average shares outstanding
More specifically, there are two types of EPS:
Basic EPS = Net income – preference shareholders/ Weighted average number of common shares outstanding
The earnings reflect earnings available to common shareholders, regardless of dividend policy and is after minority interest. Preference dividends are deducted. The weighted average number of common shares in the issue reflects the change in the number of shares in issue during the accounting period.
The other is Diluted EPS, which arises only if a firm has a complex capital structure i.e. that includes dilutive securities. These securities are any financing instruments that can be converted or exchanged into common stock, thereby potentially reducing EPS in the future. Examples of such securities are convertible debt, options and warrants (for calculations, please refer to the example in the next section).
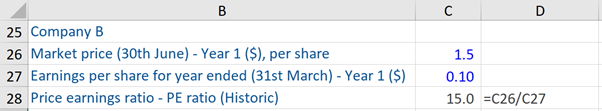
Price-earnings ratio: this ratio is used to help to decide whether a company’s equity shares are undervalued or overvalued relative to earnings. Further, it is one of the most commonly used investment ratios. The PE ratio is defined as:
Price earnings ratio = Price per share/Earnings per share
It is more useful to compare price-earnings ratios calculated using forecast rather than historic earnings per share because, to the extent that prices are driven by earnings, it is future profits that are most critical.
Dividend yield: this ratio is expressed as a percentage and shows how much dividends does a company pay out each year, relative to its stock market price. This ratio is defined as:
Dividend yield = Dividend per share/Market price
Dividend cover: this indicates an organization’s capacity to pay dividends from the profit attributable to shareholders i.e. it indicates the number of times that a company can pay dividends to shareholders from net income. The dividend cover ratio is defined as:
Dividend cover ratio = Earnings per share/Dividend per share
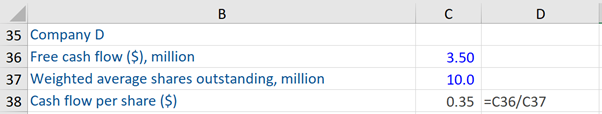
Cash-flow per share: this ratio is a profitability metric that reflects the financial strength of a company and is calculated as:
Cash-flow per share = Free cash flow/Weighted average shares outstanding
Free cash flow (FCF) = net operating assets less interest paid, less cash taxes paid, plus depreciation, plus or minus the decrease (increase) in working capital and less capital expenditure. So, FCF is the cash flow available to equity shareholders before dividends are paid.
Due to the problem of earnings as an investment performance measure, cash flow is increasingly being used, as it is not as easily manipulated by accounting policies. Therefore, cash flow is considered as a superior indicator of a company’s investment performance.
Five Investor Ratios – Example
Given below is the computation of the five investor ratios mentioned above. Download the free Excel template.