


Modeling Ratios
February 9, 2022
What are “Modeling Ratios”?
A good financial model should provide a robust and believable representation of a company’s future performance, given a specific scenario or event. i.e. it is a good predictor of reality. Historical ratios are used to build out reasonable assumptions that will drive the forecasts in the model. However, further ratio analysis should also be used once the forecasts are complete to sense check the outputs of the model i.e. to check whether the final model ‘hangs together’ well. Modeling ratios are therefore hugely important in the process of building out a good financial model.
There are a number of ratios that can be used, and the true skill is determining which key ratios are important for the specific financial modeling scenario being built out. It is also important to consider the reason for which the model is being produced and to whom the output will be presented. Including too many different ratios can be counterproductive, and the analyst must be mindful and selective when determining which ratios will be included in the model.
The trend in a company’s financial ratios over time is important in determining how the company’s performance and position evolve during the forecast period. A comparison of a company’s financial ratios against its competitors can highlight important aspects of a company’s business strategy and indicate how successful the strategy is e.g. a company selling bespoke products is expected to have a higher gross profit margin than a company selling more commodity-like products.
Financial models are most frequently used to analyze profitability, operational efficiency, and financial risk. Financial modeling ratios can therefore be broadly divided into 3 groups – profitability ratios, operating efficiency ratios, and leverage & liquidity ratios. The text below gives a brief overview of each group with some commonly encountered examples.
Key Learning Points
- Modeling ratios are used to build assumptions that drive the model’s forecasts and sense-check the outputs of a model
- There are a number of financial ratios that can be used and analysts should be selective when choosing ratios for inclusion in a financial model
- Modeling ratios are most commonly used to benchmark and analyze profitability, operational efficiency, and financial risk
Profitability Ratios
Profitability ratios are used to evaluate a company’s ability to generate profits from its operations, thereby creating value for shareholders. There are two key types of profitability ratio – margin ratios and return ratios. In a simple model, historical or trend-adjusted margins and returns can be used to forecast earnings. In a more complex model, individual line items in the income statement can be projected using separate assumptions, and then margin and return ratios can be used to sense check the forecasts.
- Margin Ratios
Margin ratios help analyze the relationship between the company’s profits and sales.
Gross profit margin is the ratio of the gross profit (sales less cost of goods sold) to sales:
![]()
Gross profit margin can be increased by raising sales prices or lowering the unit cost of goods purchased or produced.
Operating profit margin is the ratio of operating profit to sales:
![]()
Operating profit margin can be increased by raising sales prices, lowering input costs, or cutting other operating costs.
Comparing trends in gross profit margin and operating profit margin allows analysts to determine what is driving margin changes – for example, a company that reduces head office costs will see improvements in operating profit margin but no change to gross profit margin.
Although we have highlighted gross profit margin and operating profit margin above, any sub-total presented in the income statement can be represented as a margin ratio. For example, EBITDA margin is equal to EBITDA divided by sales.
- Return ratios
Return ratios show how effectively a company generates returns for its investors from its existing capital base. Return ratios are generally calculated by dividing a profit metric by the capital available to generate that profit.
Return on equity (ROE) and return on invested capital (ROIC) are the most commonly used return ratios in financial modeling:
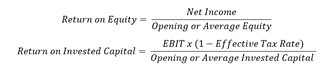
The denominator in both formulas uses book values, rather than market values and invested capital is the sum of all sources of finance (typically debt plus equity) less any financial assets (such as cash).
Companies that generate a high return on capital are allocating their resources more effectively than companies that generate a low return on capital – therefore a high return on capital is preferable. However, one of the most common errors in financial models is to predict growth in revenue and profits in the income statement, but the balance sheet forecasts do not consider the additional capital needed to fund that growth; this results in returns increasing throughout the forecast period. Therefore, return ratios are really useful in helping us check whether the balance sheet forecasts support the income statement forecasts.
Operational Efficiency Ratios
Operational efficiency ratios are used to evaluate how effectively a company utilizes its asset base to generate income. The ratios give an expectation of the operational assets and liabilities needed by a business to generate a certain level of revenue or profit. Companies that are highly efficient are expected to generate greater returns for shareholders.
There are a wide variety of different efficiency ratios that look at a range of different operational metrics. Analysts generally select a number of ratios for inclusion into a financial model based on the important operational aspects of the industry or business. The most common metrics used are ‘working capital days’ and asset turnover:
- Working capital days
Working capital days are used to evaluate the efficiency of a company’s working capital cycle and are the most common metrics used to forecast working capital:
The accounts receivables days ratio shows how long it typically takes for a company to receive the money for the goods it sells.

The inventory days ratio measures the number of days a company typically holds its inventory before selling it.
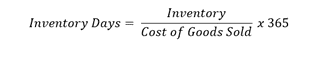
The payable days ratio measures the number of days a company typically takes to pay its suppliers.
![]()
- Asset turnover
Asset turnover helps us to analyze how efficiently a company is using its operating assets to generate revenue:

Operating assets are the sum of net PP&E, intangible assets, and net operating working capital.
Asset turnover is a useful way of checking whether forecast operating assets are adequate to support forecast revenue growth. Companies usually require additional operating assets if they want to grow revenues – for example, a retailer that wants to grow revenues may need to increase inventory levels (and therefore has higher operating working capital) or may need to open new stores (and therefore has higher PP&E).
Leverage and Liquidity Ratios
Financial risk ratios are divided into leverage and liquidity ratios..Leverage ratios measure a company’s financial risk and its ability to satisfy long-term obligations. The higher the ratio, the greater the financial leverage and the greater the risk. Liquidity ratios measure a company’s ability to meet its short-term financial obligations. The higher the liquidity ratios, the more likely the company is to be able to pay its short-term debt obligations.
Leverage ratios commonly used in financial modeling include:
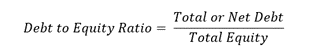
- Debt to equity ratio
The debt to equity ratio helps us to analyze the financing mix of a company during the forecast period.
- Debt to EBITDA ratio
The debt to EBITDA ratio helps us to understand how easily a company can repay its debt, as it tells us how many years a company would take to pay its debt using EBITDA.

Transaction models (e.g. M&A and LBO models) typically use ‘total debt’ in the ratio whereas investment research models typically use ‘net debt’.
Although there are a range of liquidity ratios that can be used. The most commonly used ones include:
- Current ratio
The current ratio is a quick and easy way to check whether a company’s current assets are sufficient to meet current liabilities as they fall due.
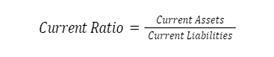
A current ratio of less than one is a red flag as it means the company does not have sufficient cash, inventory and receivables in the balance sheet to meet its current liabilities.
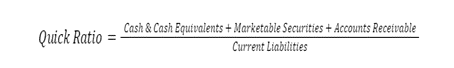
- Quick ratio
The quick ratio, also known as the acid test, is a more conservative measure of liquidity because it excludes inventories and less liquid assets from the current assets in the numerator.
In addition to the leverage and liquidity ratios referenced above, analysts should also include any other leverage ratios that are used as covenants for existing finance facilities.
Profit Margins – Example
Given below is a sample calculation of the gross profit margin and operating profit margin of Company A for Year 1 and Year 2.
The analyst producing the model will contextualize these ratios by comparing them to previous time periods or to other companies with a similar profile.
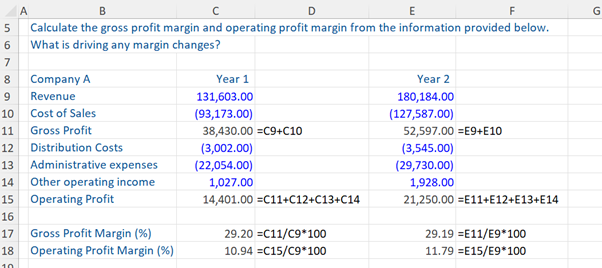
Download the accompanying Excel exercise sheets to practice the calculation on your own and to see the answer for what is driving margin changes.
Conclusion
Modeling ratios are a critical component of any financial model. They are used to analyze historical trends in the company’s performance, and they are used as forecast drivers that help inform the forecasting assumptions of the model. Ratio analysis should also be used once the forecasts are complete to sense-check the outputs of the model. There are several ratios that can be used for any given analysis, but the analyst must be skillful and selective when determining which ratios are most important. Modeling ratios are most commonly used to benchmark and analyse profitability, operational efficiency, and financial risk.
Additional Resources
Investment Banking Certification
Linking Three Financial Statements