
Sign up to access your free download and get new article notifications, exclusive offers and more.
Economic Value Added Excel Workout

Economic Value Added (EVA)
September 3, 2025
What is Economic Value Added (EVA)?
Economic Value Added (EVA) and Market Value Added (MVA), are widely recognized as shareholder-focused performance measures.
The concept was developed and popularized by Joel Stern and Bennett Stewart, founders of Stern Stewart & Co. EVA and MVA were introduced to address a critical limitation: while a company’s primary objective is to maximize shareholder wealth, the traditional financial statements such as the income statement, balance sheet, and cash flow statement do not fully reveal how investors perceive value creation. To bridge this gap, EVA and MVA combine accounting performance with market expectations, offering a clearer view of whether management is truly generating shareholder value.
Key Learning Points
- EVA measures management’s one-year performance in creating value
- MVA measures the total cumulative wealth created since inception
- EVA calculates a company’s true economic profit by subtracting the full cost of its capital (both debt and equity) from its after-tax operating profit
- EVA is determined by NOPAT, WACC, and Invested Capital, each requiring specific adjustments for accuracy
- For a precise EVA, it’s crucial to adjust EBIT for non-recurring items, use the effective tax rate for NOPAT, use the end-of-period WACC, and take the average of beginning and end-of-period Invested Capital
What is Market Value Added (MVA)?
A firm can maximize shareholder wealth by maximizing the difference between the current market value of equity and the equity contributed by shareholders. This difference is known as Market Value Added (MVA) and the formula is the market value of equity minus the total common equity.
MVA = Market value of Equity – Total Common Equity
Let’s look at public company, Nvidia and get details of its market value and financial statements from Felix. We can see from the data provided that as of August 1, 2025, Nvidia’s diluted market value of equity was US$4.3tr.

Source: Felix
When we look at the balance sheet for the most recent period, we can see that Nvidia’s total common equity is valued at US$79bn.

Source: Felix
Using the MVA calculation we can subtract US$79bn from the US$4.3tr equity value to result in an MVA of approximately US$4.2tr.

How Economic Value Added (EVA) Works
While MVA evaluates long-term performance since inception, EVA provides a one-year snapshot of management’s effectiveness in creating value.
EVA reflects a company’s economic profit, that is, profit generated after accounting for the full cost of capital (both debt and equity). Unlike traditional accounting measures, EVA explicitly recognizes that capital has a cost. Profits exceeding this cost are “economic value added.”
Economic Value Added (EVA) Formula
Here is the formula to calculate EVA:
EVA = NOPAT – (WACC x Invested Capital)
Where:
NOPAT (Net Operating Profit After Tax):
NOPAT = EBIT*(1-Tax Rate)
WACC (Weighted Average Cost of Capital):
WACC= (Kd * (1-Tax Rate) * Debt / ((Debt + Equity))) + (Ke*Equity / ((Debt + Equity)))
- Kd = Cost of debt and Ke = Cost of equity
Invested Capital:
Invested Capital = Interest Bearing Debt + Long Term Operating Leases Shareholders’ Equity
Required Adjustments for EVA Calculation
Step 1: EBIT Adjustments
Adjust EBIT to remove the impact of one-time or non-recurring items. For example, add back restructuring expenses and deduct gains from asset sales. If a company already reports “adjusted EBIT,” that figure can typically be used as the starting point.
Step 2: Tax Rate Selection
Use the effective tax rate rather than the statutory rate when calculating NOPAT. The effective rate more accurately reflects the actual tax burden applied to operating profits.
Step 3: WACC Timing
Apply the end-of-period WACC, as it represents the most up-to-date cost of capital demanded by investors and lenders.
Step 4: Invested Capital Averaging
Use the average of beginning and end-of-period capital invested. Capital employed often changes during the year due to new investments, asset sales, or shifts in working capital. Since NOPAT is earned across the period, comparing it against the average capital base provides a fairer and more logical assessment. Relying solely on beginning capital may understate the capital employed if significant new investments were made, while using only end-of-period capital may overstate it if assets were disposed of.
Why NOPAT is Preferred Over Net Income?
EVA is designed to measure the profitability of a company’s operations without being influenced by financing choices.
Net income includes interest expenses, which means it reflects only the cost of debt financing. This creates an imbalance because it captures the debt portion of capital employed but ignores the cost of equity capital. Equity investors also expect a return, and that cost is not reflected in net income.
NOPAT, on the other hand, excludes all financing costs and isolates operating performance. This makes it the right profit measure for EVA, since the full cost of both debt and equity is accounted for separately through the WACC calculation.
Nvidia Example – Calculating Economic Value Added for a Company
Using Felix, we can gather all the data required to calculate EVA for a company. Let’s look at an example using the US-listed company, Nvidia.
Step 1: Calculate NOPAT
We can access Nvidia’s income statement data via Felix to calculate NOPAT.
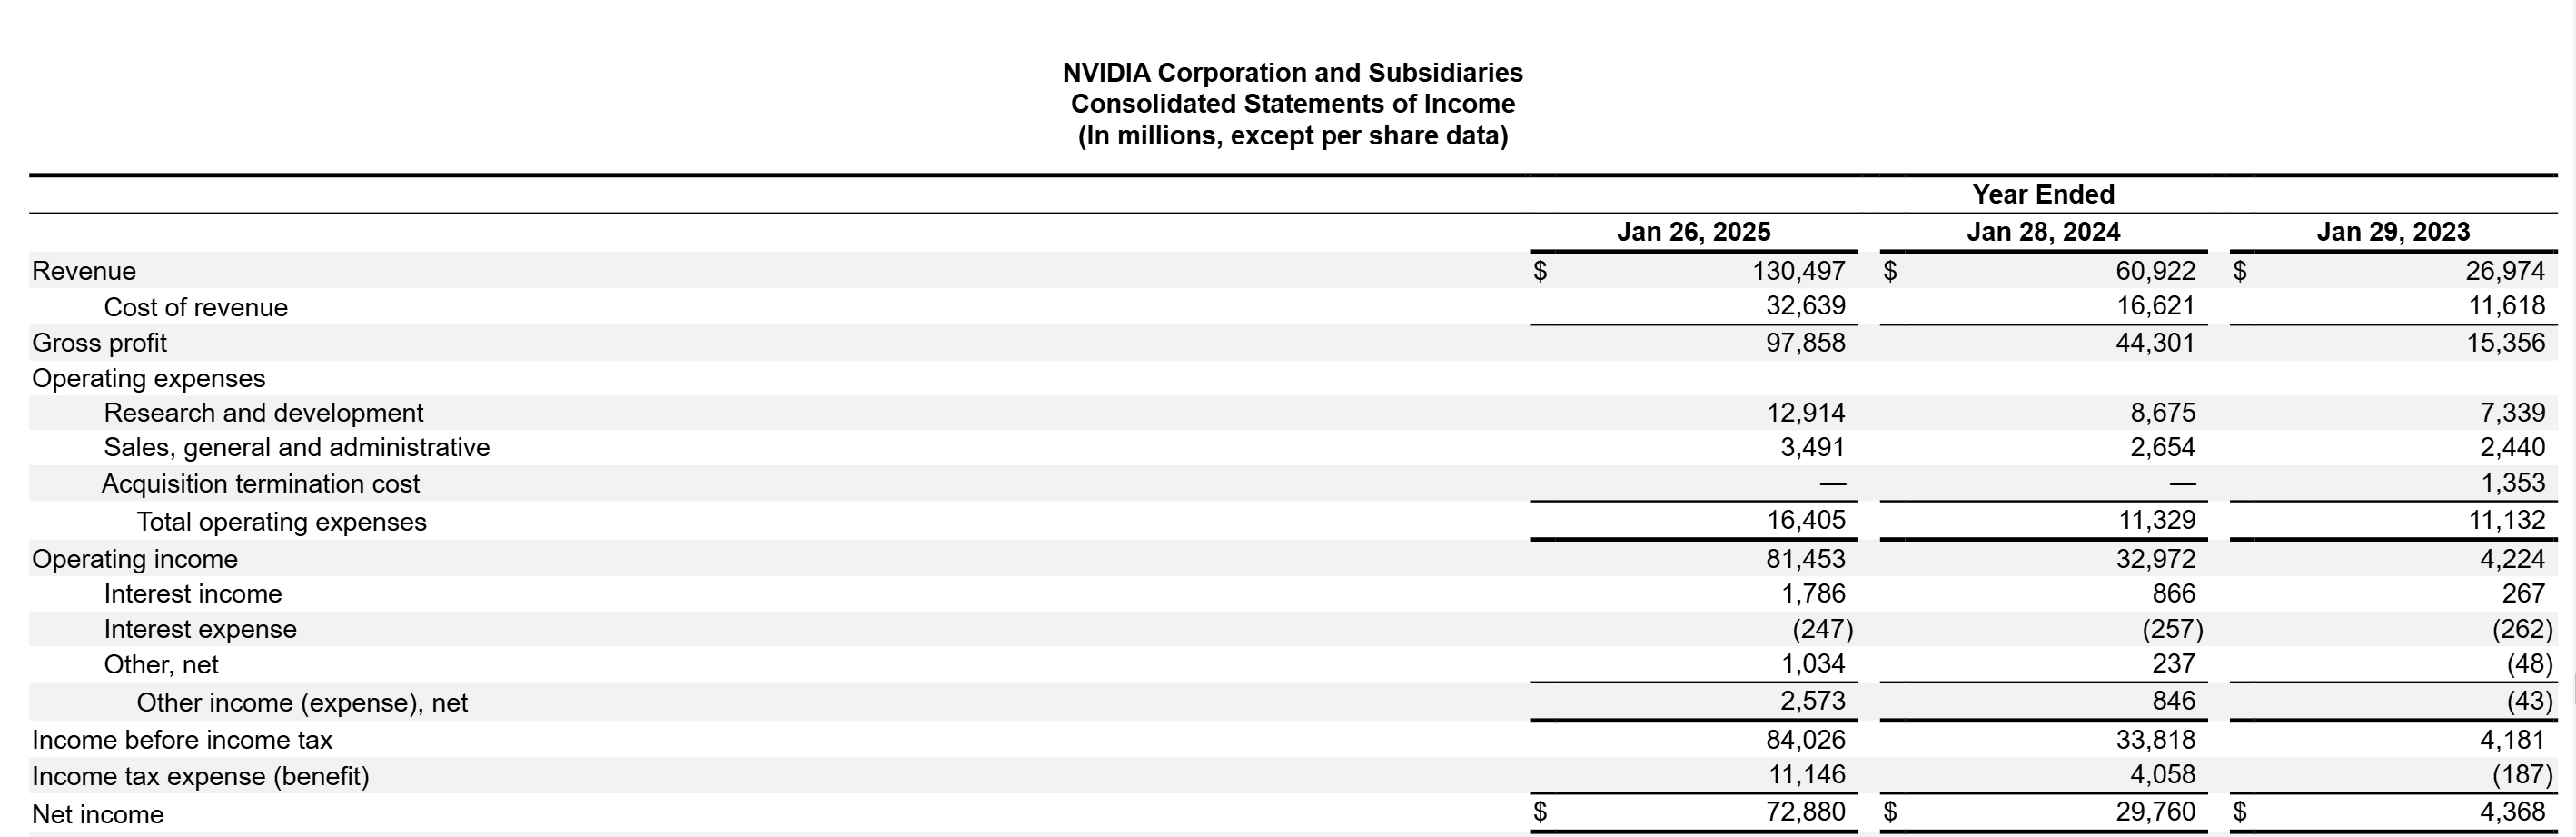
Source: Felix
Taking EBIT and calculating the effective tax rate from the information provided, we can derive NOPAT. Download the free Financial Edge template to follow these calculations and create your own EVA and MVA model.

Step 2: Calculate WACC
WACC information is readily available for US and European listed companies on Felix. Users can access this data by typing in the company name or ticker. In our example this is Nvidia. The WACC function details the 10-year government bond yield (or alternative options), a suggested equity risk premium as well as the beta and the cost of debt.
For Nvidia the WACC is calculated as 16.87% on the 1st August 2025.
Source: Felix
Step 3: Calculate Invested Capital
The third step when calculating EVA is to calculate the invested capital.
Again, using Felix we can access Nvidia’s balance sheet data for the appropriate period and enter it into the downloaded EVA excel template.

For Nvidia, the average invested capital is calculated as US$71,558.
Step 4: Calculate EVA
Finally, we can take the calculations and use them to derive the EVA.

Nvidia generated an EVA of ~$59bn during FY2024-2025, indicating that its operating profits comfortably exceeded the full cost of capital employed.
Pros and Cons of Calculating EVA
There are several pros and cons of using EVA so let’s look at them in a little more detail.
Pros of EVA
Focus on True Profitability – Unlike net income or accounting profit, EVA explicitly deducts the cost of all capital, including equity. This ensures managers and investors evaluate whether the business is truly generating returns above the opportunity cost of funds deployed. A positive EVA confirms genuine wealth creation.
Applicable Beyond the Corporate Level – EVA is versatile; it can be applied not only at the company level but also at divisional or project levels to assess whether specific initiatives or business units are generating returns more than their cost of capital.
Promotes Capital Discipline – When integrated into management incentives, EVA encourages efficient use of assets and careful capital allocation. It discourages investments that show accounting profits but fail to deliver returns above the cost of capital.
Reduces Accounting Distortions – EVA often requires adjustments to reported financials, such as removing one-off items or reclassifying expenses. These adjustments make results more reflective of economic performance.
Cons of EVA
Complexity in WACC Calculation – Estimating WACC is not straightforward, particularly the cost of equity, which depends on assumptions such as beta and the market risk premium. These inputs can vary significantly, leading to different EVA outcomes.
Less Suitable for Asset-Light Businesses – EVA traditionally works best for asset-intensive companies. For businesses that rely heavily on intangible assets such as brands, software, or patents, the associated spending is often expensed immediately rather than recorded on the balance sheet as an asset. This understatement of capital employed means the balance sheet does not fully capture the true investment base, making EVA less accurate for such firms.
Backward-Looking Metric – EVA evaluates past performance and does not automatically capture future value creation. Strategic investments, such as large R&D programs that are expensed in a given year, can reduce EVA in the short term but may generate substantial shareholder value in the long run.
Not Comparable Across Companies in Isolation – EVA is an absolute measure, for example, “$10m value created”. This makes it difficult to compare across firms of different sizes or industries. For effective benchmarking, EVA should be paired with relative metrics such as ROIC, ROI, or EVA divided by average capital employed. These ratios normalize the results and provide a clearer basis for comparison across companies and sectors.
Conclusion
EVA is a powerful metric that goes beyond traditional accounting measures to capture a company’s true economic value creation. By charging profits with the full cost of capital, it provides a clearer assessment of whether the business is generating returns in excess of investor expectations.
Although its calculation can be complex, requiring adjustments and subjective assumptions, EVA remains highly valuable for aligning management incentives with shareholder interests, promoting disciplined capital allocation, and serving as a reliable tool for both internal performance evaluation and external financial analysis.