
Steady State Workout
Send download link to:
Featured Product
Steady State
July 21, 2021
What is “Steady State”?
A company reaches a steady state when all sources of competitive advantage are exhausted (it fails to create any future value), and its profitability and efficiency ratios stabilize. In this state, the company earns no economic profit (i.e. ROIC = WACC) and competitive advantage.
The steady state phase is after the explicit forecast period used to calculate a company’s forecasted free cash flows (FCF), which is used in a discounted cash flow analysis (DCF). The value of steady state cash flows can be summarized or captured in a single number, termed as terminal value. Valuation analysts typically forecast a company’s free cash flow for 5-10 years into the future (which ends in the company achieving steady state performance). The cash flows beyond the explicit forecast period are assumed to grow at a constant growth rate each year.
Key Learning Points
- There are six ratios that can be used for sense checks for steady state
- The steady state growth rate is used to calculate the terminal value from steady state (the year 2043 in the example given below) until infinity in a DCF
- There are six factors that can be used to determine when a company has reached steady state conditions
Sense Checks on Key Ratios for Steady State
Forecasted free cash flows are based on many assumptions, which largely concern business drivers and the company’s expected future performance. These assumptions go beyond the forecast period and are also applicable in the steady state period of a company.
Analysts need to be reasonable about the assumptions used to ensure an accurate and reasonable valuation. Here are some sense checks for analysts to check their key ratios for reasonableness:
| Ratio | Status in steady state |
| Sales growth | Modest |
| EBIT margin | Modest |
| Capex (% of sales) | Modest |
| Operating working capital (% of sales) | Steady |
| ROIC | Just above WACC |
| Replenishment ratio (Capex/depreciation) | Just above 1 assuming inflation |
| Cash conversion ratio (FCF/NOPAT) | Higher due to reduced investment requirements |
| Reinvestment rate (1-cash conversion rate) | Lower |
| Long-term capital structure (the mix between debt and equity) | Closer to the industry average |
Sense Checks for steady State – Example
Given below is an example to understand the forecasting process and use of ratios to sense check the forecast. In the example below, the management has provided forecast data for the first 3 years of a company. We need to extrapolate from here to produce a 10-year free cash flow forecast. The forecast should illustrate “steady state” by year 10.

The following additional assumptions for the 10-year FCF forecast are stated below:
- Sales growth should be stepped down until it reaches 2.5% level and thereafter set at this steady state level. The steady state growth rate is used to calculate the terminal value from steady state till infinity.
- The steady state Capex level is 4.5% of sales. It should be stepped down to 5.5% for the first two years, then 5.0% for another two years and 4.5% for the remaining forecast period.
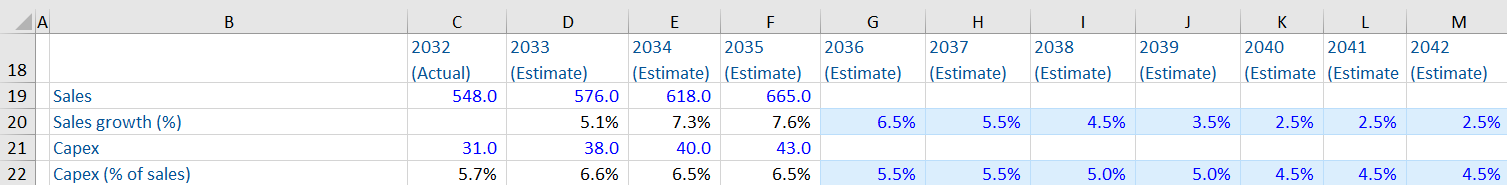
Calculating Management Forecasts
First, we calculate two ratios based on the management forecast to understand the underlying trends of the company.

Here, we need to reduce sales growth and Capex as a % of sales such that they illustrate steady state by the year 2042.
Once this is done, we calculate the forecasted sales and Capex for the remaining forecast period.
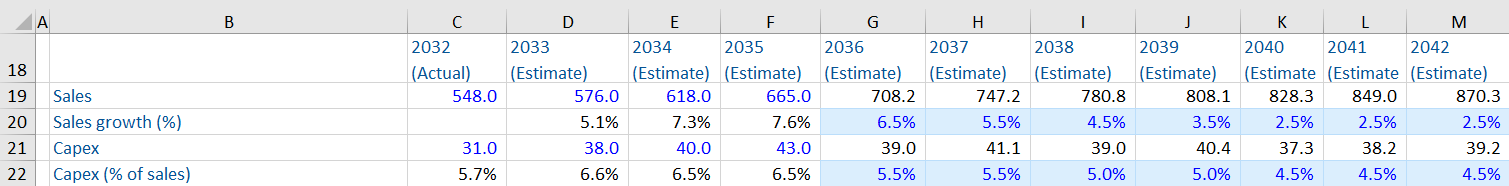
In practice, analysts make such adjustments for each of the key ratios and the free cash flows until the growth rate reaches a steady state. The forecasting stops at this stage (the year 2042 in this example.) Analysts use the steady state growth rate to calculate the terminal value from steady state (the year 2043) into infinity.
Factors to be Considered to Determine Steady State:
There are six indicators that could be used to understand when a company has reached steady state conditions:
- The effective tax rate approaches the marginal tax rate
- There is reduction in margins, due to no competitive advantage
- Returns on equity fall as the business matures and the gap between the same and WACC goes on decreasing
- Sound long-term capital structure – one sign of steady state is when the long-term capital structure (i.e. the mix between debt and equity) of a company is closer to the industry average
- The gap between growth and long-term inflation decreases or narrows i.e. as the business matures, it grows at a rate that gradually comes closer and closer to the rate of inflation
- The business exhibits stable capital expenditure and free cash flows