
Ratio Analysis Workout
Sign up to access your free download and get new article notifications, exclusive offers and more.
Recommended Course

What is Ratio Analysis?
October 1, 2021
What is “Ratio Analysis”?
The term ratio analysis refers to using investment ratios (and multiples) to gain quantitative insight into a company’s profitability, liquidity, and operational efficiency. The ratios are drawn from a company’s past and present financial data. It can be used to look at an individual company’s performance, or comparatively across a sector, region, or peer group.
There are various approaches to classifying ratios. One approach is to classify them as investor ratios and the other as management ratios. Investor ratios are used by equity investors to evaluate a company’s health and ability to generate the return for their investment – given the risks involved.
Management ratios can be subdivided into operating, financial, and cash flow ratios. These ratios look more carefully at the ways in which a company is organized and managed at the fundamental level of the business – namely operating performance and financial structure. Further, if ratios are to be of any value, they must be related to other information benchmarks – such as previous performance of the company – trends, other companies (who are competitors), and forecasts or budgets.
Key Learning Points
- Ratio analysis is a process of investigating a company’s operating performance looking at different metrics
- There are seven most common types of investor ratios that are used by equity analysts and investors
- The management ratios can be subdivided into operating, financial, and cash flow ratios
Investor Ratios
There are seven most common types of investor ratios used by equity analysts/investors. These are:
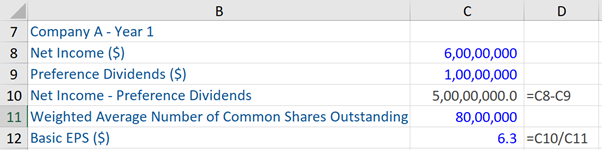
Earnings per share: this is defined as the ratio of net income to the weighted average shares outstanding of a company. This ratio generally indicates the profitability of a company.
Earnings Per Share (EPS) = Earnings / Weighted average shares outstanding
More specifically, there are two types of EPS:
Basic EPS = Net income – Preference shareholders / Weighted average number of common shares outstanding
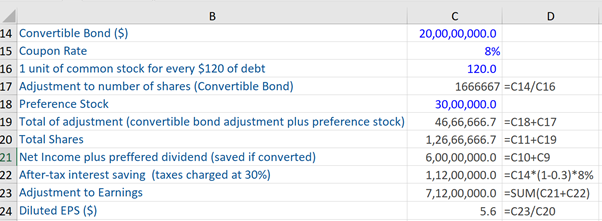
The other is Diluted EPS, which arises only if a firm has a complex capital structure i.e. that includes dilutive securities. These securities are any financing instruments that can be converted or exchanged into common stock, thereby potentially reducing EPS in the future. Examples of such securities are convertible debt, options, and warrants (for calculations, please refer to the example in the next section).
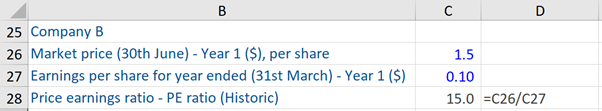
Price-earnings ratio: this ratio is used to help to decide whether a company’s equity shares are undervalued or overvalued relative to its earnings. It is one of the most commonly used investment ratios and can be helpful to compare a peer group or look at sector trends.
The PE ratio is defined as:
Price-earnings ratio = Price per share / Earnings per share
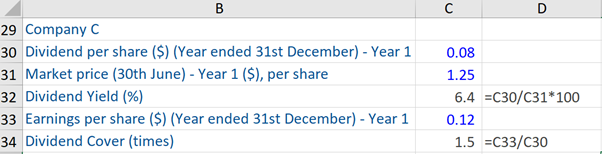
Dividend yield: this ratio is expressed as a percentage and shows how much dividends a company pays out each year, relative to its stock market price. Often dividends are paid out by well-established firms or mature sectors with consistent cash flows. Quite often, less well-established companies will not pay a dividend to its shareholders as it invests earnings into the future growth of the company.
This ratio is defined as:
Dividend yield = Dividend per share / Market price
Dividend cover: this ratio indicates an organization’s capacity to pay dividends from the profit attributable to shareholders i.e. it indicates the number of times that a company can pay dividends to shareholders from net income. The dividend cover ratio is defined as:
Dividend cover ratio = Earnings per share / Dividend per share
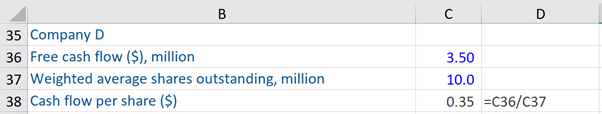
Cash-flow per share: this ratio is a profitability metric that reflects the financial strength of a company and is calculated as:
Cash-flow per share = Free cash flow / Weighted average shares outstanding
Free cash flow (FCF) is calculated as: net operating assets less interest paid, fewer cash taxes paid, plus depreciation, plus or minus the decrease (increase) in working capital, less capital expenditure. So, FCF is essentially the cash flow available to equity shareholders before dividends are paid.
Net Asset Value per Equity (NAV) ratio = Equity shareholders funds / Number of equity shares in issue * 100
Enterprise Value ratios: the enterprise value of a company is the current market value of the business on a de-geared basis ie. It is a measure of the underlying value of the business after having allowed for the debt/cash position of the company and represents the aggregate value of a company to all its providers of capital.
There are three types of enterprise value ratios and the formulas for the same are:
Enterprise value / EBIT
Enterprise Value / EBITDA
Enterprise Value / Sales
Management Ratios
There are three types of management ratios: operating, financial, and cash flow ratios.
A. Operating ratios
Operating ratios: these ratios measure the rate of return earned on the assets/capital employed in the business and are usually sub-analyzed into profit margins and asset use/turnover. These ratios are:
Return of assets / Capital employed: this ratio expresses profits as a percentage of the assets in use/capital employed in the business and can be subdivided into profit margins and asset turnover. The formula for this ratio is:
Profits / Assets and the same can be subdivided into:
Profit Margins = Profits / Turnover (i.e. Profit before interest payable and tax / Turnover)
Asset Turnover = Turnover / Assets (i.e. Turnover / Asset capital employed)
These ratios are interrelated. Further:
Profits / Assets = Profits / Turnover + Turnover / Assets
This is often referred to as Du Point Analysis.
Return on Capital Employed for a year can be calculated by:
Profit before interest payable and tax / Total assets * 100
or
Profit before interest payable and tax / Total assets less current liabilities * 100
or
Profit before interest payable and tax / Total assets less ádjusted’ current liabilities * 100
Returning to profit margins, there are two different measures of profit margin on sales:
Gross profit margin = Gross profit / Turnover*100
Operating profit margin = Operating Profit / Turnover* 100
Next, coming to the Working Capital Cycle (in addition to considering the long-term financing of a company, attention should also be accorded to short-term financing – often referred to as Working Capital Cycle). The key question here is whether or not a company has sufficient current assets to meet its current liabilities. The three key ratios to calculate when assessing the liquidity of a company is:
Current ratio: Current assets / Current liabilities
Quick ratio: Cash + Marketable securities + Receivables / Current liabilities
Cash ratio: Cash + Marketable securities / Current liabilities
Now we turn to financial ratios.
B. Financial ratios
Financial ratios: these ratios can be subdivided into two categories: gearing ratios, and liquidity and coverage ratios. Historically, lenders have used balance sheet gearing ratios to control risk in relation to loan lendings. Balance sheet gearing is a yardstick of a company’s financial structure.These ratios are:
Borrowings to equity: borrowings are allowed to rise when stockholder’s equity or net worth increases. This is provided that borrowings never exceed a permitted multiple or percentage of stockholder’s equity. The formula for this ratio is:
Borrowings / Equity * 100
Debt/equity: equity shareholders will normally want to establish the relationship between their interests in capital and reserves (equity interest) and the claims of others with a prior entitlement (borrowings and non-equity interests). This is often referred to as the debt/equity ratio.
The formula for this ratio is:
Debt (Borrowings + Non-equity interests) / Equity interests * 100
There are certain drawbacks of balance sheet gearing ratios. Balance sheets have ceased to be a relevant measure of a company’s worth, as economies have moved from manufacturing to services. A ratio of borrowings to shareholders’ funds in the balance sheet may not represent a helpful measure of debt relative to equity. So, other more relevant measures to measure gearing have been devised by investment analysts, for example, Debt/Market capitalization ratio.
Next, are the interest cover ratios:
Interest cover ratios: These include interest cover and cash flow cover ratios. The ratios measure how easily companies can service their borrowings. Their respective formulas are:
Operating profit/interest payable
Operating cash flow/interest payments
C. Cash flow ratios
Cash flow ratios: these ratios are increasingly used to analyze both operating performance and financial efficiency of a company.
The cash flow ratios to measure Operating Performance are:
Operating cash flow / Sales: this ratio looks at the cash generated as a percentage of sales and the formula for the same is:
Net operating cash flow / Turnover * 100
Operating cash flow / Total assets: this ratio compares the cash generated from operations with the total investment in the business. The formula for the same is:
Net operating cash flow / Total assets * 100
Net operating cash flow / Capex: this is a capital expenditure cover ratio. The formula for the same is:
Net operating cash flow / Payments to purchase tangible non-current items * 100
Cash flow ratios for Financial Analysis are:
Debt repayment in years: this ratio can be a good indicator of whether a business is exceeding debt capacity. The formula for the same is:
Total debt / Cash flow available to service debt
Interest cover and debt servicing ratios: these ratios measure the level of cash flows generated by a company which is available to service debt. Their respective formulas are:
Interest cover = Cash flow available to service debt/interest expense
Debt servicing = Cash flow available to service debt/interest expense and principal
Five Investor Ratios – Example
Given below is the computation of five investor ratios:
Take our financial modeling course and learn how to build financial models from Wall Street Experts.
Additional Resources
Complete Investment Banking Course
Linking Three Financial Statements